
01 / THE MARKET / THE COMPANY / OCTOBER 23, 2026 THE MARKET FELL. |  |
Inside the business behind Wall Street—and the companies building the infrastructure of finance.
| Visit TheInvestorCall.com → |
THE MARKET / THE COMPANY / THE OPPORTUNITY
| NDAQ | CME | ICE | CBOE | FCCN |
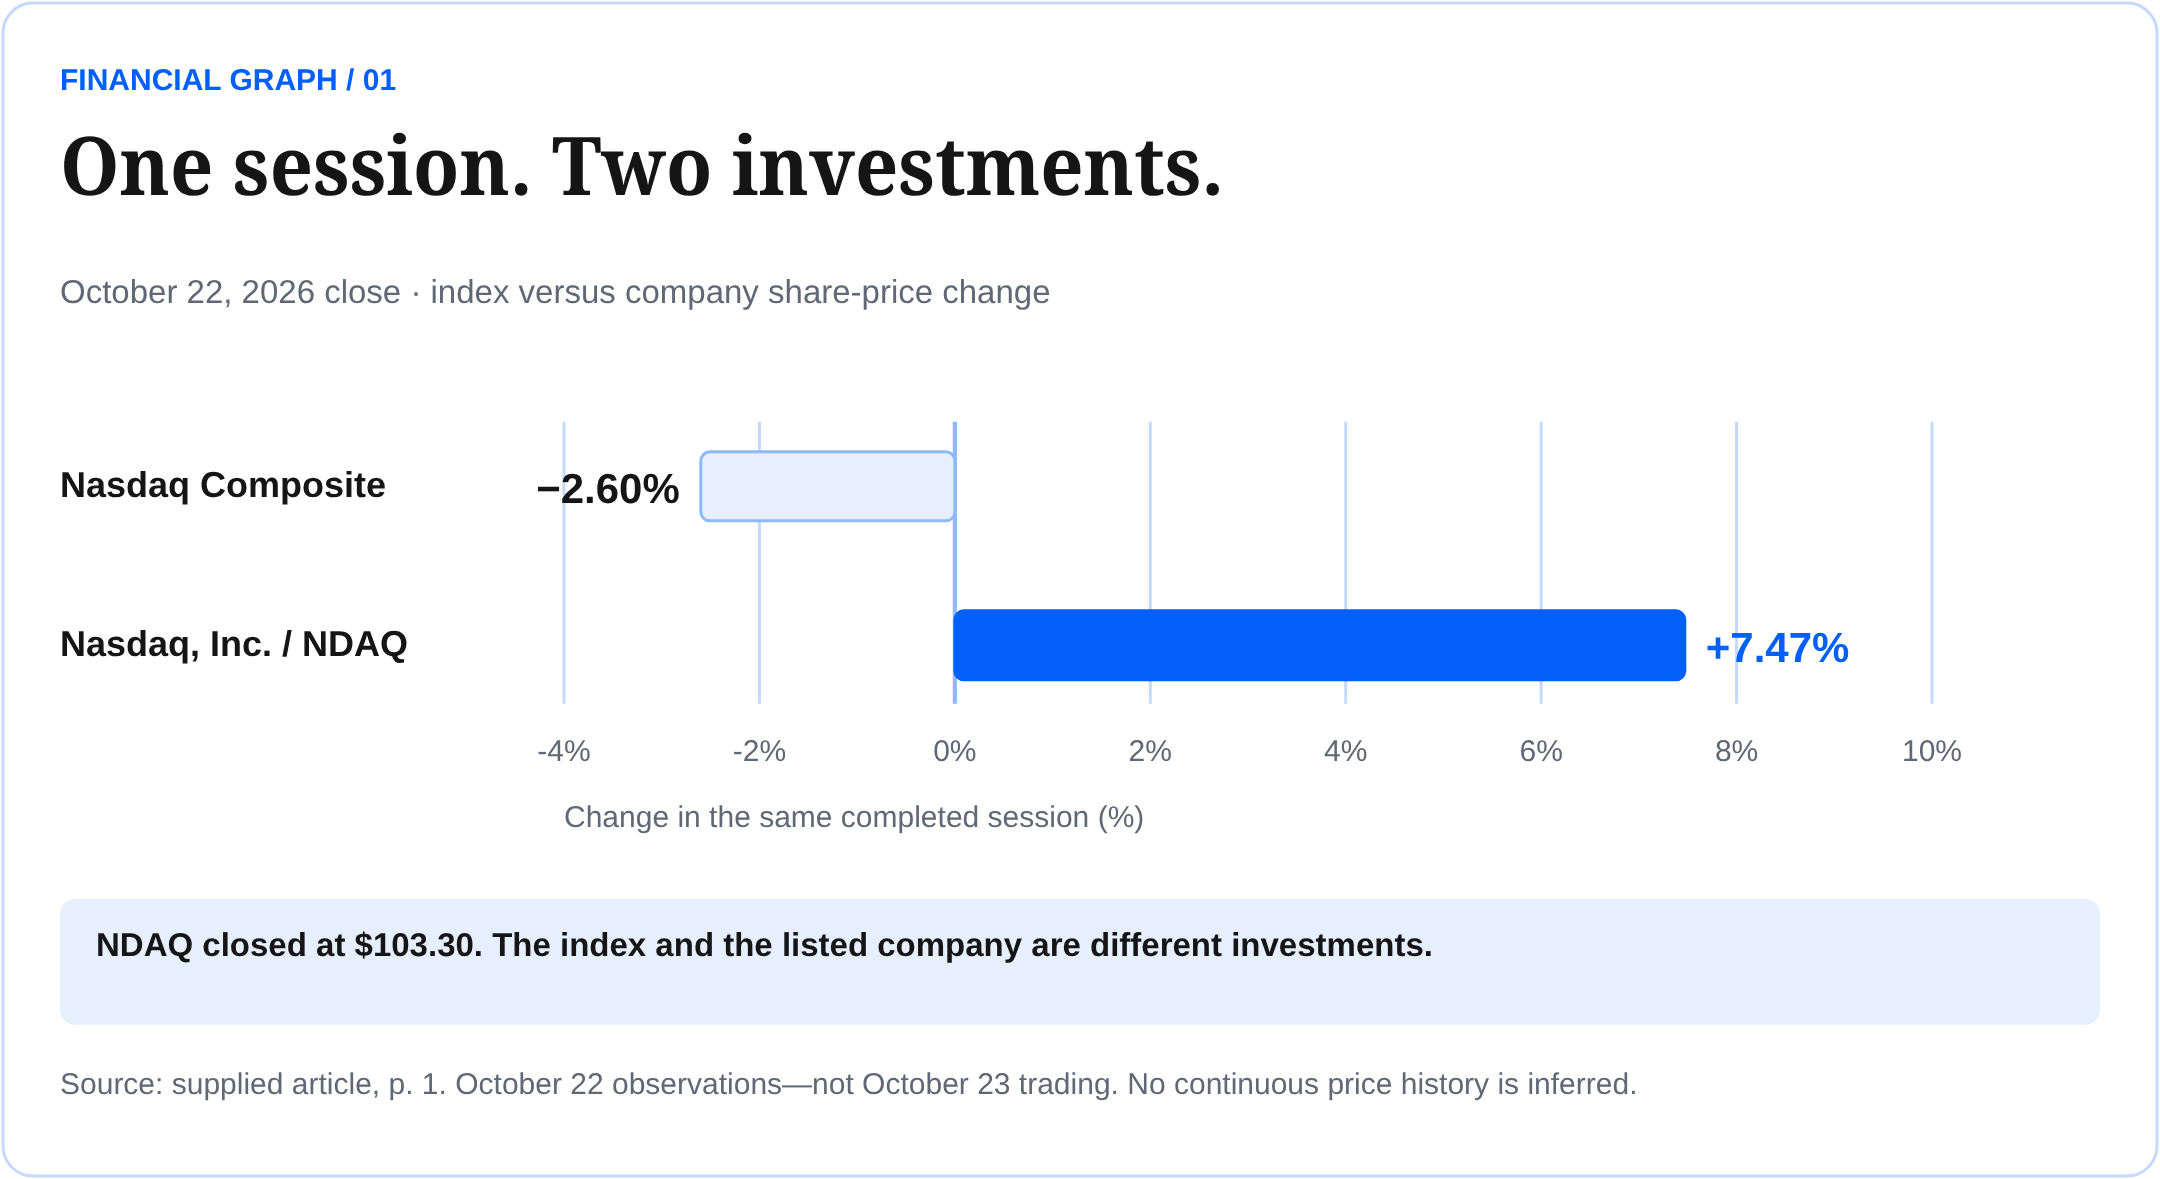
On Thursday, October 22, the Nasdaq Composite fell 2.6%. Shares in Nasdaq, Inc. rose 7.47% to $103.30. The contrast invites a closer look at a business investors may recognize by name before they understand its earnings.
The Composite is an index measuring a group of shares. The exchange is a trading venue. Nasdaq, Inc. is the listed company whose activities extend into financial software, data and index products.
A screen full of stock prices is the visible surface. Behind it, institutions need technology to trade, process information and meet reporting obligations. Customers pay for those capabilities.
Our investment interpretation: the infrastructure supporting finance deserves the same research as the companies trading on it. Start with the customer, follow the revenue and then examine the price of the shares.
What are Nasdaq’s customers actually paying for?
Research dated October 23, 2026. Market moves above refer to October 22, not October 23 trading. All dollar figures are U.S. dollars. Investment interpretations are editorial judgments.
02 / NDAQ / THREE REVENUE ENGINES Understand the customer. |  |
Trading is one engine. Software, data, listings and indexes broaden the business.
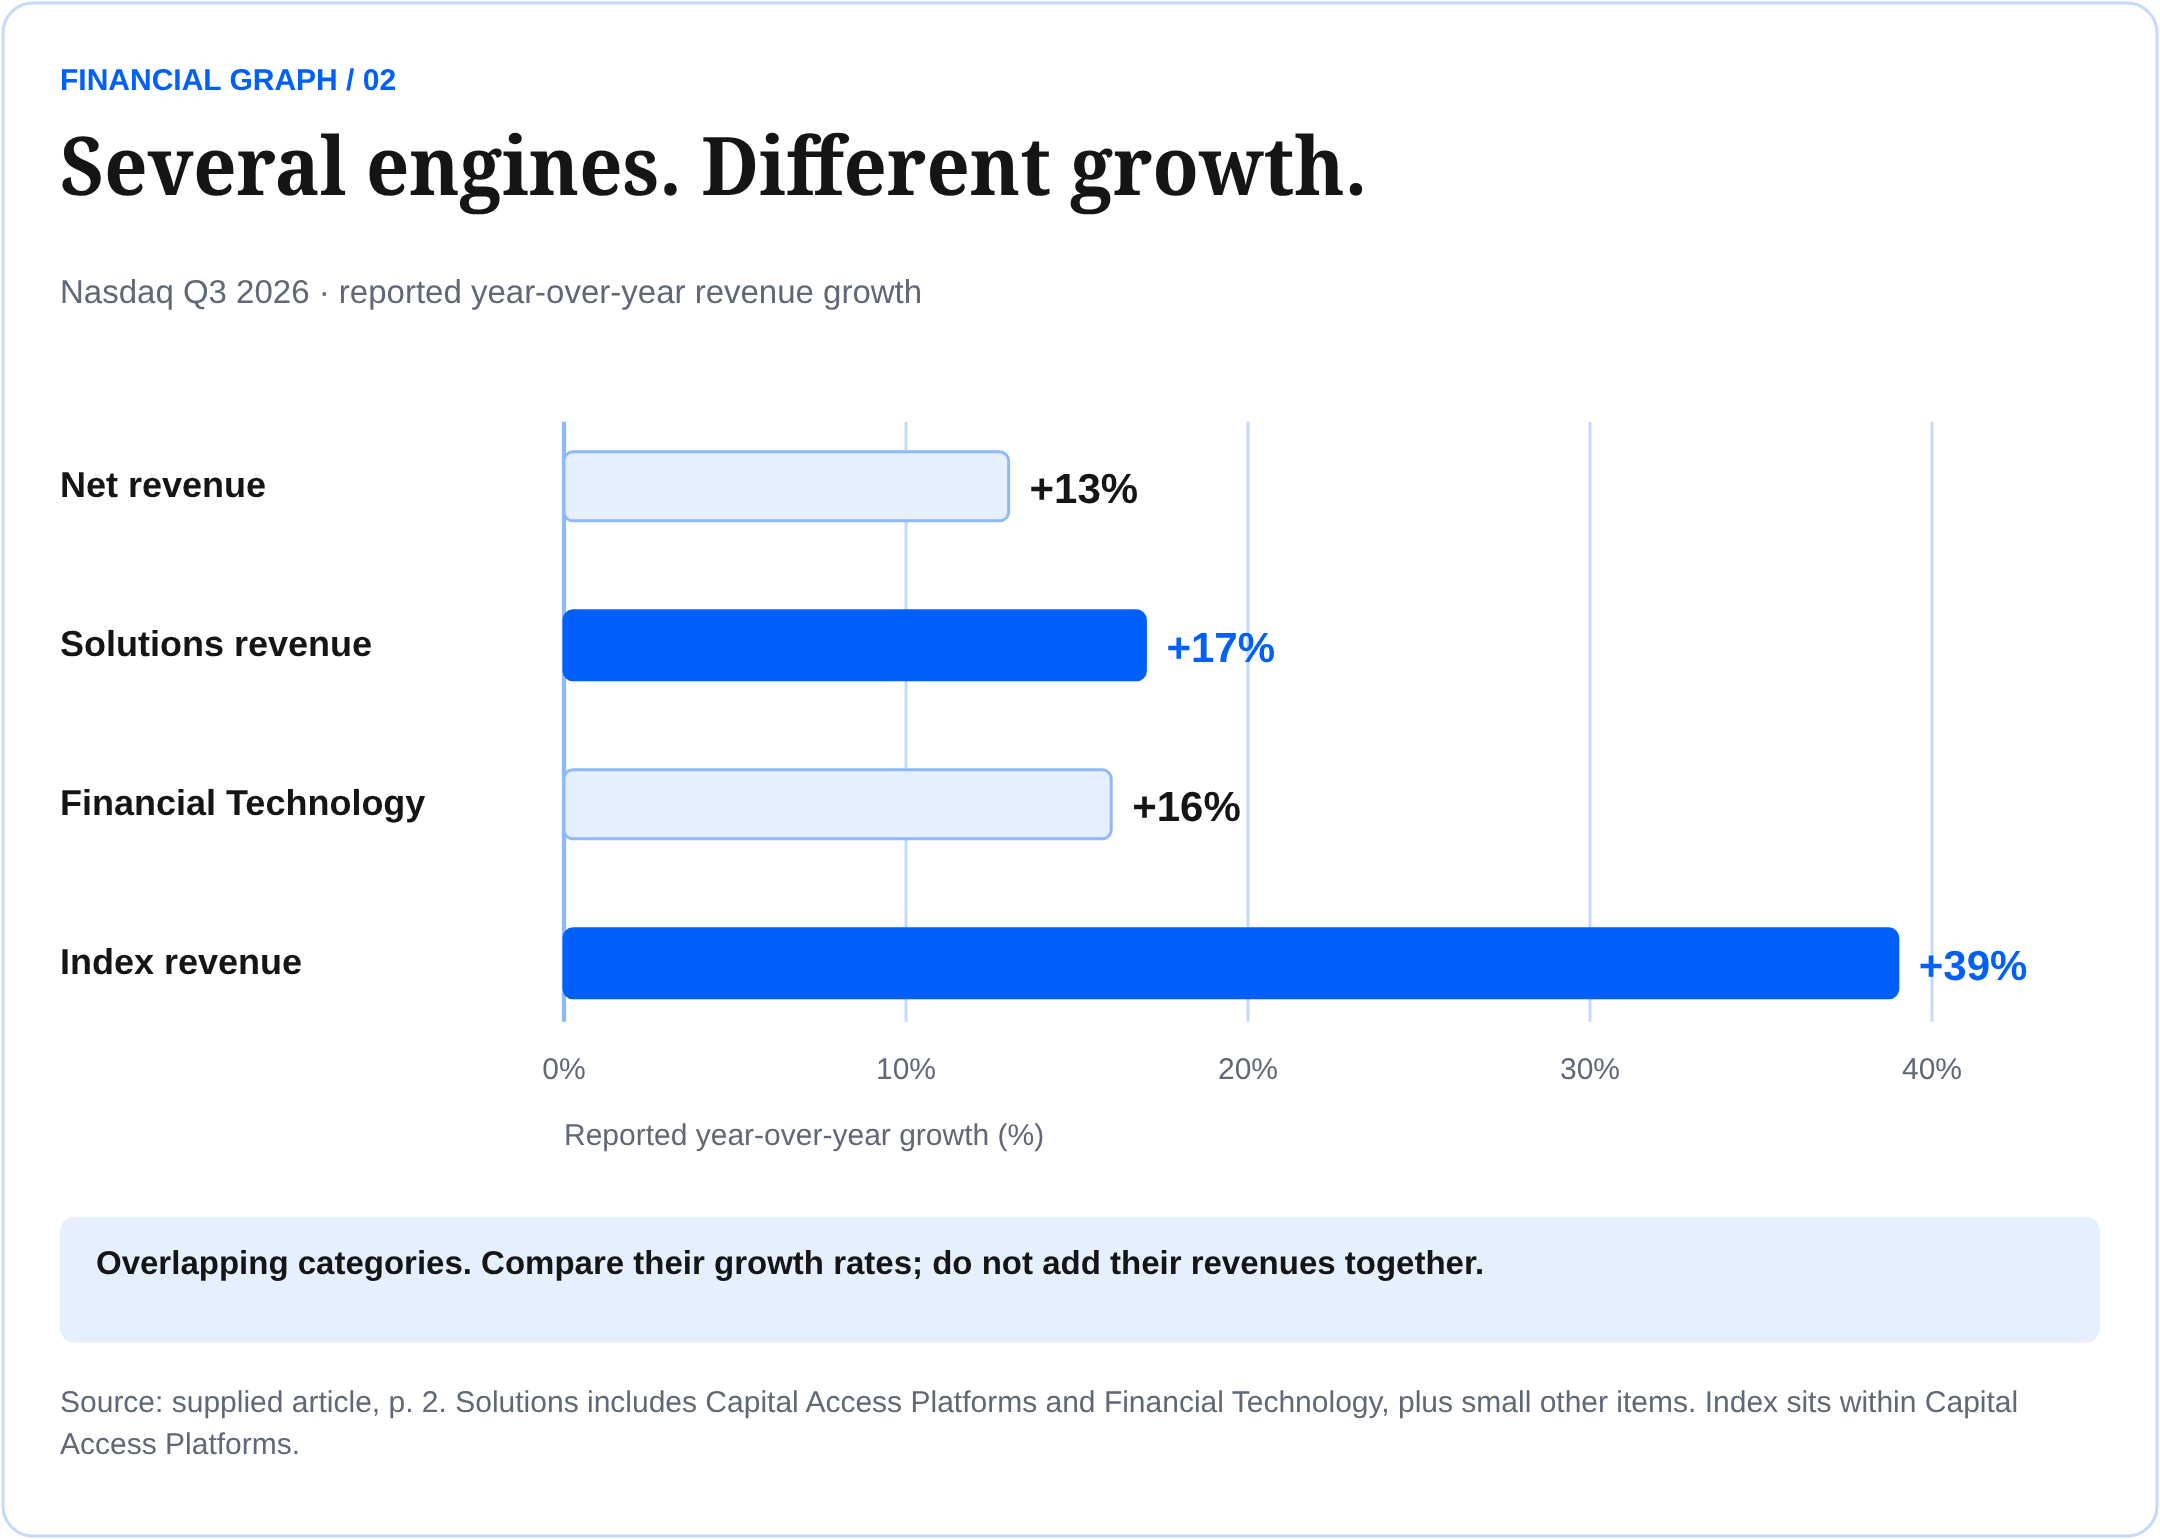
$1.481B Q3 net revenue · +13% YoY | $1.172B Solutions revenue · +17% | $1.04 Adjusted diluted EPS |
Q3 2026 / THE EARNINGS DASHBOARD
Measure | Q3 2026 | YoY growth |
|---|---|---|
Financial Technology revenue | $529M | +16% |
Index revenue | $286M | +39% |
GAAP diluted earnings per share | $0.96 | +31% |
Solutions includes Capital Access Platforms and Financial Technology, plus small other items. Index is within Capital Access Platforms. These rows overlap; do not add them together.
Market Services
Trading participants pay for execution and related market services. The economics depend on activity, market share and the revenue retained after transaction-related costs. Gross trading revenue should not be confused with net revenue.
Capital Access Platforms
Issuers, investors and product providers buy listings, data, indexes and tools. Research each separately: a new listing, a data contract and an index license have different commercial drivers.
Financial Technology
Financial institutions buy software to support complex workflows. Recurring contracts and additional products sold to existing customers can make progress visible beyond any single trading session.
Follow the mix
Our reading: growth across several customer needs offers a broader thesis. The next task is to establish which revenues recur, what customers retain and how growth translates into profit per share.
Trading is one engine.
Software, data, listings and indexes broaden the business.
Year-over-year reported growth. Net revenue is after transaction-based expenses. GAAP uses standard U.S. accounting; adjusted EPS is a company-defined non-GAAP measure. See linked reconciliations.
03 / SOFTWARE + INDEXES / THE ECONOMICS OF USE The customer’s workflow. |  |
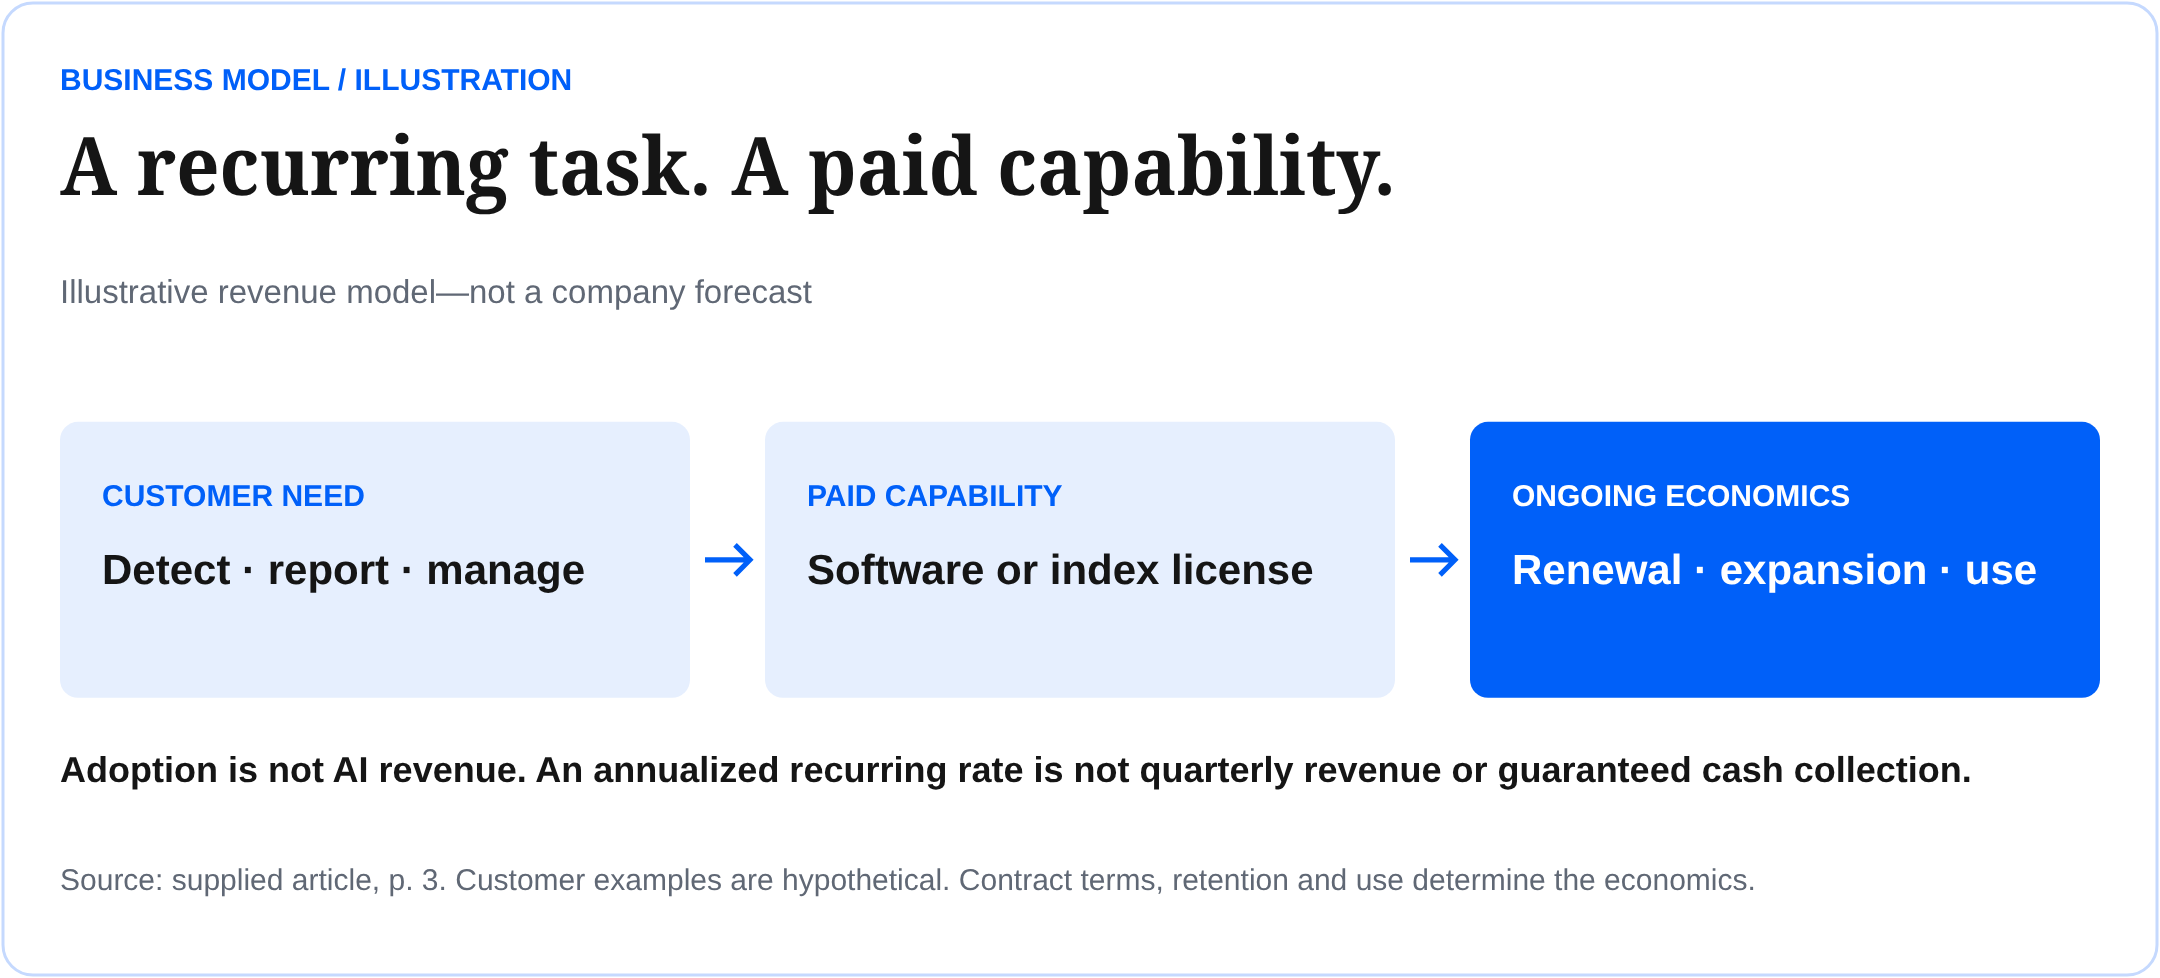
A useful product solves a recurring task. A durable business keeps earning the customer’s renewal.
54 New FinTech clients · Q3 | 135 FinTech upsells · Q3 | $3.4B Total annualized recurring revenue |
A bank, before opening time
Hypothetical example: a bank reviews suspicious payments, prepares regulatory reports and manages collateral. Each job requires reliable data and a workable process.
Verafin supports financial-crime detection and investigation. AxiomSL supports regulatory reporting and data management. Calypso supports treasury and capital-markets workflows. Their usefulness comes from the job performed for the customer.
Nasdaq reports over 850 clients using Verafin’s Agentic AI Workforce. This adoption count does not establish AI revenue or profit. Follow renewals, expansion and customer value.
An index can earn a fee
A fund provider can license a Nasdaq index as the basis for an investment product. Contracts can charge according to assets under management or transaction activity. Product design and licensing terms determine the economics.
Hypothetical example: a licensed fund attracts new money. An asset-based fee can grow with the fund’s asset base. Market declines can reduce that base even when the relationship continues.
Our interpretation: evaluate adoption and contract economics together. Annualized recurring revenue describes an annual rate; it is neither quarterly revenue nor a guarantee of future collections.
A durable business keeps earning the customer’s renewal.
Q3 2026 company-reported client metrics. Upsells expand an existing relationship. ARR is annualized recurring revenue; total ARR rose 12% reported, versus 14% organically. Examples are hypothetical.
| Visit TheInvestorCall.com → |
04 / NDAQ / GROWTH AT WHAT PRICE? A good business. |  |
The investment case rests on repeatable earnings, cash after investment and disciplined capital allocation.
$521M Q3 operating cash flow | $8.74B Short- + long-term debt · Sep. 30 | 24.8× Illustrative earnings multiple |
Turn growth into ownership value
Q3 GAAP operating income was $732 million. Diluted weighted-average shares fell 2.7% year over year, from 579.0 million to 563.3 million, supporting per-share results.
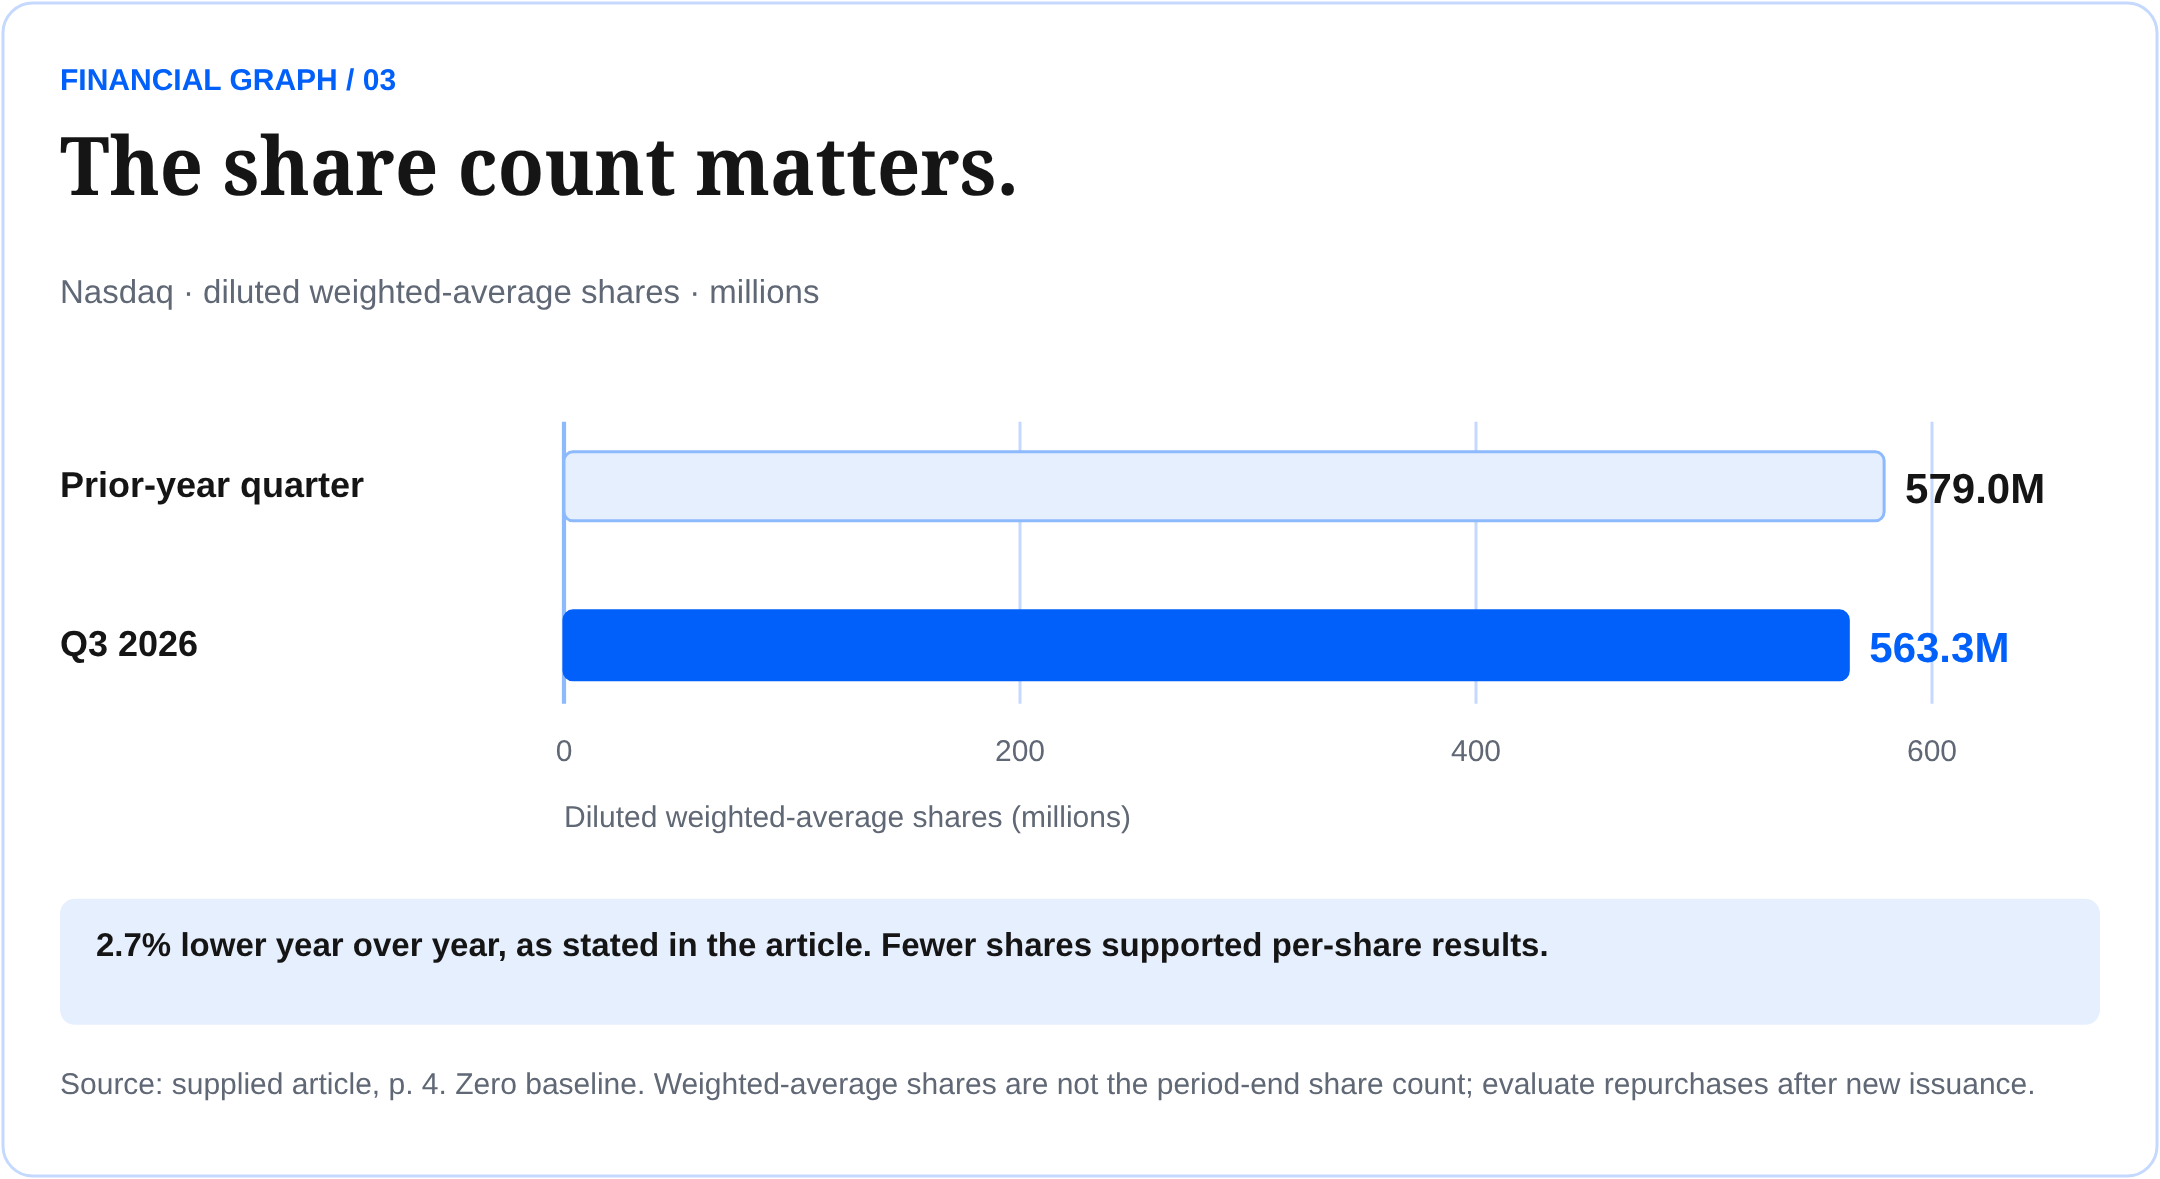
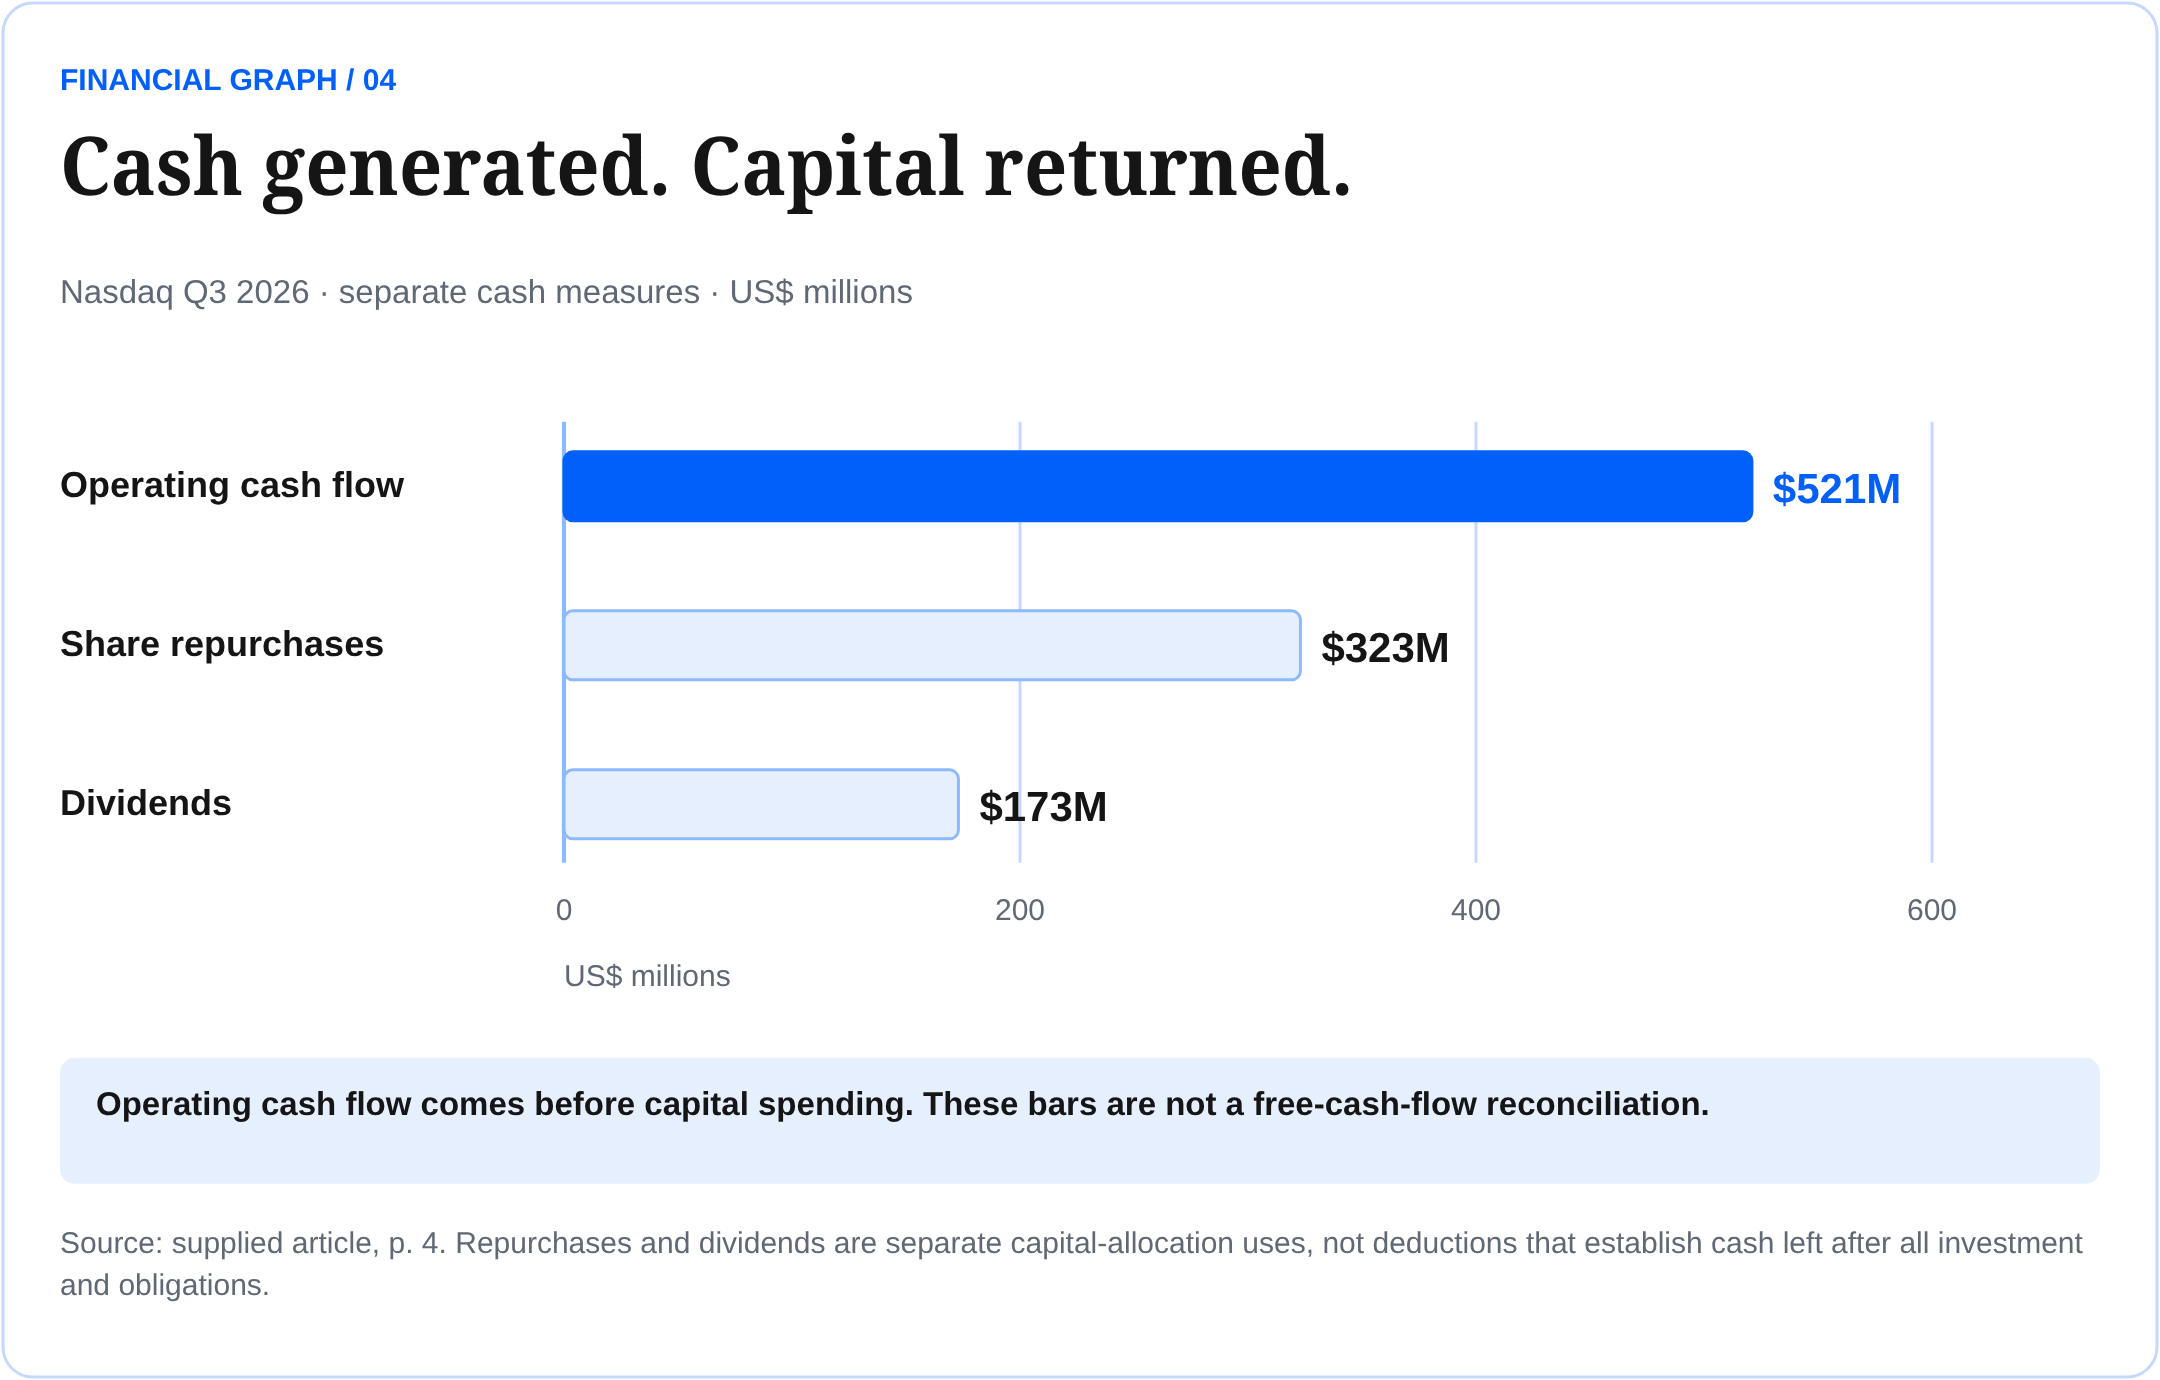
Quarterly buybacks totaled $323 million; dividends were $173 million. Evaluate repurchases against the share base after new issuance.
Operating cash flow precedes capital spending. Examine cash left after platform investment, debt service and acquisition commitments.
Recurring is a starting point
Follow renewals, retention and account expansion. ARR helps identify momentum; contract quality, delivery costs and cash collection complete the picture. No retention percentage is assumed.
Be precise about the multiple
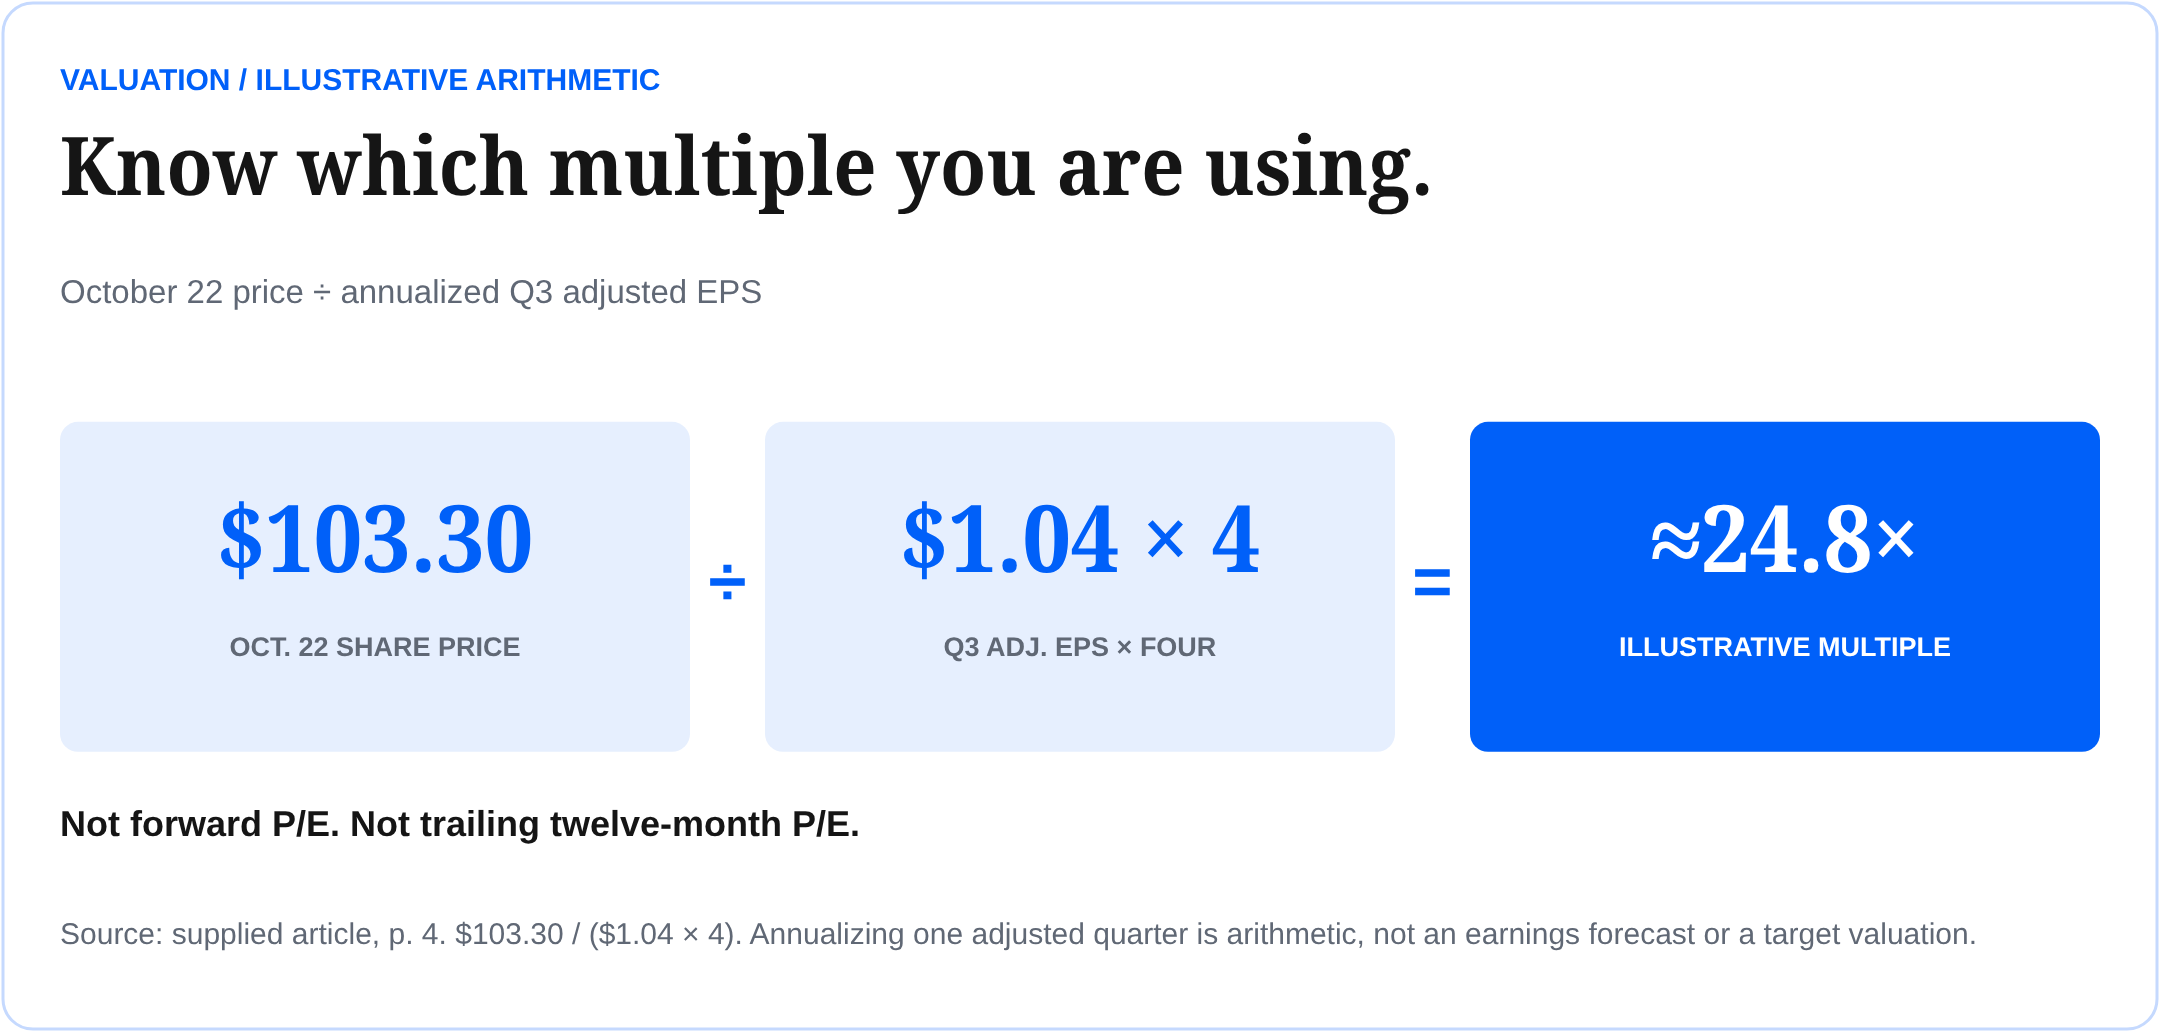
At the October 22 close of $103.30, dividing by four times Q3 adjusted EPS of $1.04 gives about 24.8 times annualized quarterly adjusted earnings. This is a simple illustration, not forward P/E or trailing twelve-month P/E.
Our interpretation: future growth must reward the price paid. Compare consistent earnings measures, cash generation and reinvestment needs before choosing an entry price.
A longer trading day
Nasdaq says it is preparing for 23-hour trading, five days a week, with a December 6 launch target. It has completed the LeveL Markets acquisition as part of its infrastructure strategy.
Participation, liquidity, incremental fees and costs will show whether longer hours improve economics. Base today’s earnings case on demonstrated performance.
What must Nasdaq deliver over the next several years to justify today’s valuation?
Calculations: debt = $269M + $8,471M; multiple = $103.30 / ($1.04 × 4).
05 / FIVE STOCKS / FIVE BUSINESS MODELS Research the infrastructure. |  |
Four financial-market operators and one communications platform. Each requires its own investment thesis.
Software, data, indexes and trading. Q3 Solutions grew 17%. Next: recurring growth and cash after reinvestment. |
Derivatives trading, clearing and data fees. Q3 ADV: 29.4M contracts, a Q3 record. Next: volume-to-revenue conversion. |
Exchange, clearing, data and technology services. Q3 Brent options volume set a record. Next: fee capture and earnings conversion. |
Options, futures and market services. September index-options ADV rose 22.3% YoY. Next: revenue per contract and product mix. |
FCCN / SPECTRAL CAPITAL CORP. / COMMUNICATIONS + TECHNOLOGY
An operating base to build on
Spectral operates international voice and messaging services through Telvantis Voice Services and 42 Telecom. The announcement filed on September 18 describes a strategy to apply software and intellectual property to the operations of companies. Current telecommunications revenues to date are telecommunications revenues. The future holds enormous potential for revenue and profit growth simply through the implementation of these technologies in the technology industry worldwide.
The filing distinguishes between acquired, filed patent applications and internally developed, not-yet-filed applications. These represent development resources whose commercial value must first be demonstrated through implementation.
Allow time for implementation
The report shows cash on hand of $5.267 million as of June and proposes financing for business and product development. The proposed proceeds already account for a large portion of the financing. The next milestones are the funded market launch, customer acquisition, and cash generation.
Our editorial assessment: Learn more about FCCN now, assess whether its execution justifies a long-term position, and allow verified progress time to unfold. A patient investor should focus on operational evidence; future appreciation remains an investment outcome, not a certainty.
Each requires its own investment thesis.
Research candidates, not an allocation model or ranking. ADV means average daily volume. FCCN is a communications and technology-development case; it is not an exchange operator. Read each company’s full disclosures.
06 / THE INVESTOR CALL / YOUR NEXT STEP Research. Invest with conviction. |  |
Research the business. Invest with conviction.
Give long-term value time to develop.
Dear reader,
The opening price move earns our attention. The work that follows determines whether a company deserves a place in a portfolio. Understand who pays, why the service matters and how revenue becomes cash for shareholders.
With NDAQ, investigate the quality of its recurring business and the valuation attached to it. With CME, ICE and Cboe, understand product economics. With FCCN, follow the connection between operating communications services and verified technology execution.
Make patience an active decision
Form a thesis before you buy. Record the milestones that would strengthen it, and revisit them as new filings arrive. A long holding period is useful when the business continues developing in the direction your research anticipated.
We invite you to keep researching with The Investor Call: specific companies, understandable economics and evidence worth following. Let business progress give you reasons for conviction over time.
Research the business.
Invest with conviction.
Hold with purpose.
EXPLORE YOUR TRADING PLATFORM
| Fidelity | Charles Schwab |
| Interactive Brokers | Tiger Trade |
Country eligibility, ticker availability, OTC access and trading permissions vary by broker and account. Verify FCCN access directly. Tiger’s global site may route to a local entity; these links do not establish eligibility in Estonia or elsewhere.
Educational research and editorial opinion, not personalized investment advice. Returns are not assured. Sources are linked throughout; company statements and plans are distinguished from our interpretation. Prices use the October 22 close. Body typography uses the approved template’s Arimo fallback.
| Subscribe now for free | Get in touch with our team |
Production note. This presentation retains the supplied October 23, 2026 article’s figures, claims, dates and linked destinations. They have not been independently verified or updated. The graphics visualize the supplied figures; they are not live market data.
| Visit TheInvestorCall.com → |
 Research that matters. Insight you can trust. |  |
