
01 / CONSUMERS / THE NEXT INVESTMENT STORY / OCTOBER 28, 2026 The consumer's wallet |  |
People are still spending - but their choices are changing. Which businesses turn everyday purchases into lasting shareholder value?
|
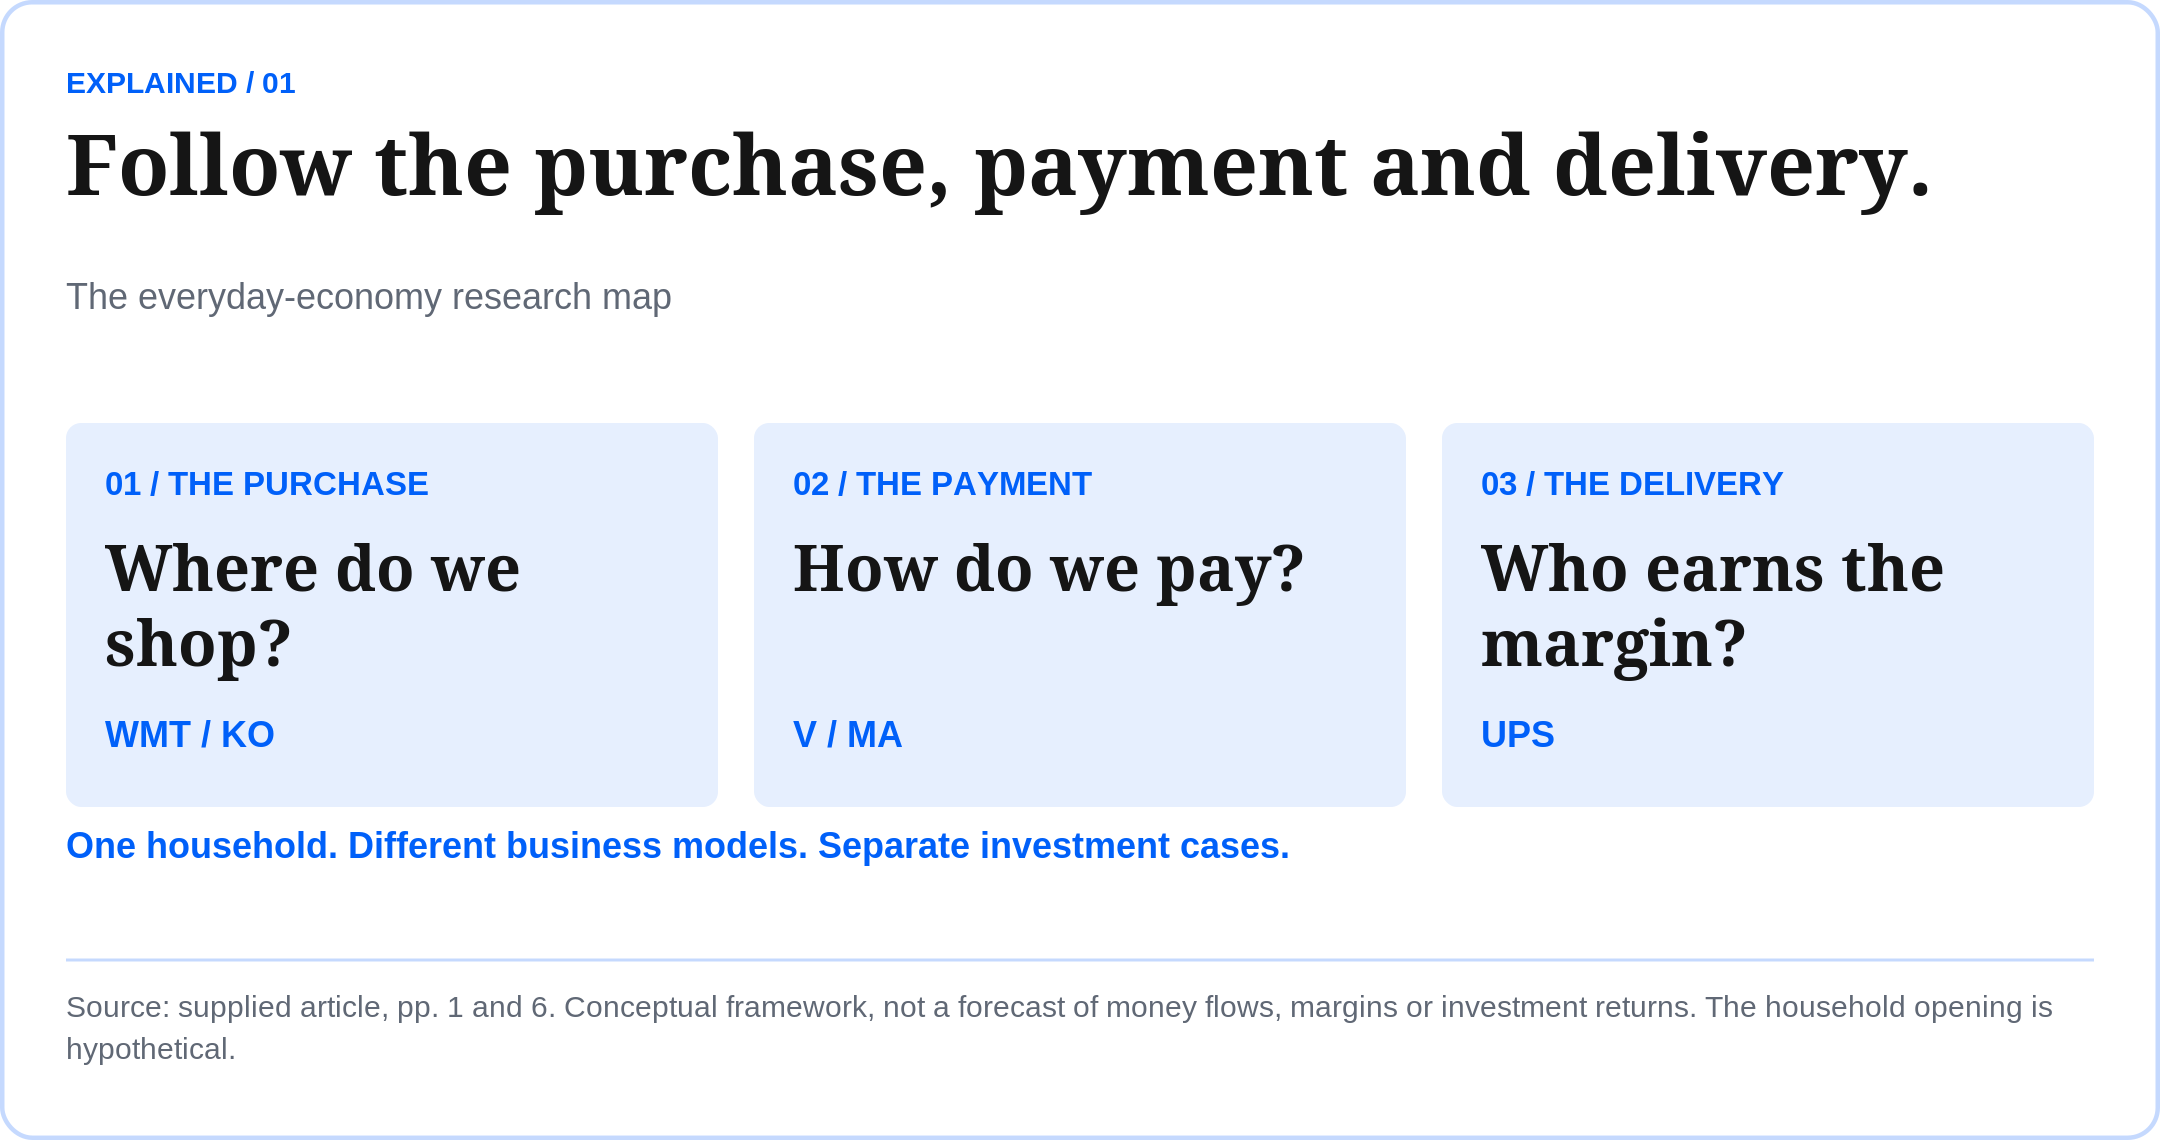
Imagine a family reviewing its spending on Sunday evening. The grocery bill feels higher. A delivery charge looks unnecessary. A holiday remains on the calendar, but the hotel needs another comparison. Someone cancels a subscription. Someone else orders new shoes.
This hypothetical household illustrates a useful investment question: what happens when people become more selective without stopping spending altogether? They compare prices, change stores, postpone one purchase and protect another.
For investors, the opportunity begins with those choices. Which business wins the next visit? Which brand stays in the basket? Which company turns the purchase into cash rather than simply a larger sales number?
Our investigation follows Walmart, Coca-Cola, Visa, Mastercard and UPS. Each sees a different part of commerce: where people shop, what they choose, how payments move and what it costs to deliver the goods. No single company describes every household.
UPS's new third-quarter release supplies a fresh example: revenue increased while average daily U.S. domestic package volume declined. The relationship between activity, pricing and profit deserves a closer look.
We examine the latest results verified at our research cutoff, then ask what would justify an investment. These are five research candidates. The business evidence and the price paid must support each decision.
The receipt can grow while the shopping basket shrinks.
Prepared October 27 for the October 28 edition. Research cutoff: October 27, 2026. KO and Visa use earlier verified results; new scheduled releases are not assumed. All financial figures are U.S. dollars unless stated otherwise.
02 / WALMART / WMT The budget is limited. |  |
A retailer can gain a larger share of household spending even when customers are watching every dollar.
$187.9B Q2 FY27 company revenue / +5.9% | +2.6% Walmart U.S. comp sales / ex-fuel | +24% Walmart U.S. e-commerce sales |
Winning the next visit.
For a retailer, growth can come from capturing spending that previously went elsewhere. A customer may keep the same grocery budget while moving more purchases to one destination. That makes store choice as important as the direction of total household spending.
Walmart's figures describe several layers of that activity. Company revenue includes international operations. U.S. comparable sales measure an existing operating base, including e-commerce. Online growth overlaps with the stores fulfilling orders. These rates should not be added together.
The release identifies a pharmacy-pricing headwind affecting comparable sales. Read product categories and transaction trends before concluding that one headline describes the whole customer base. Our question is whether traffic, value and convenience support repeat purchases.
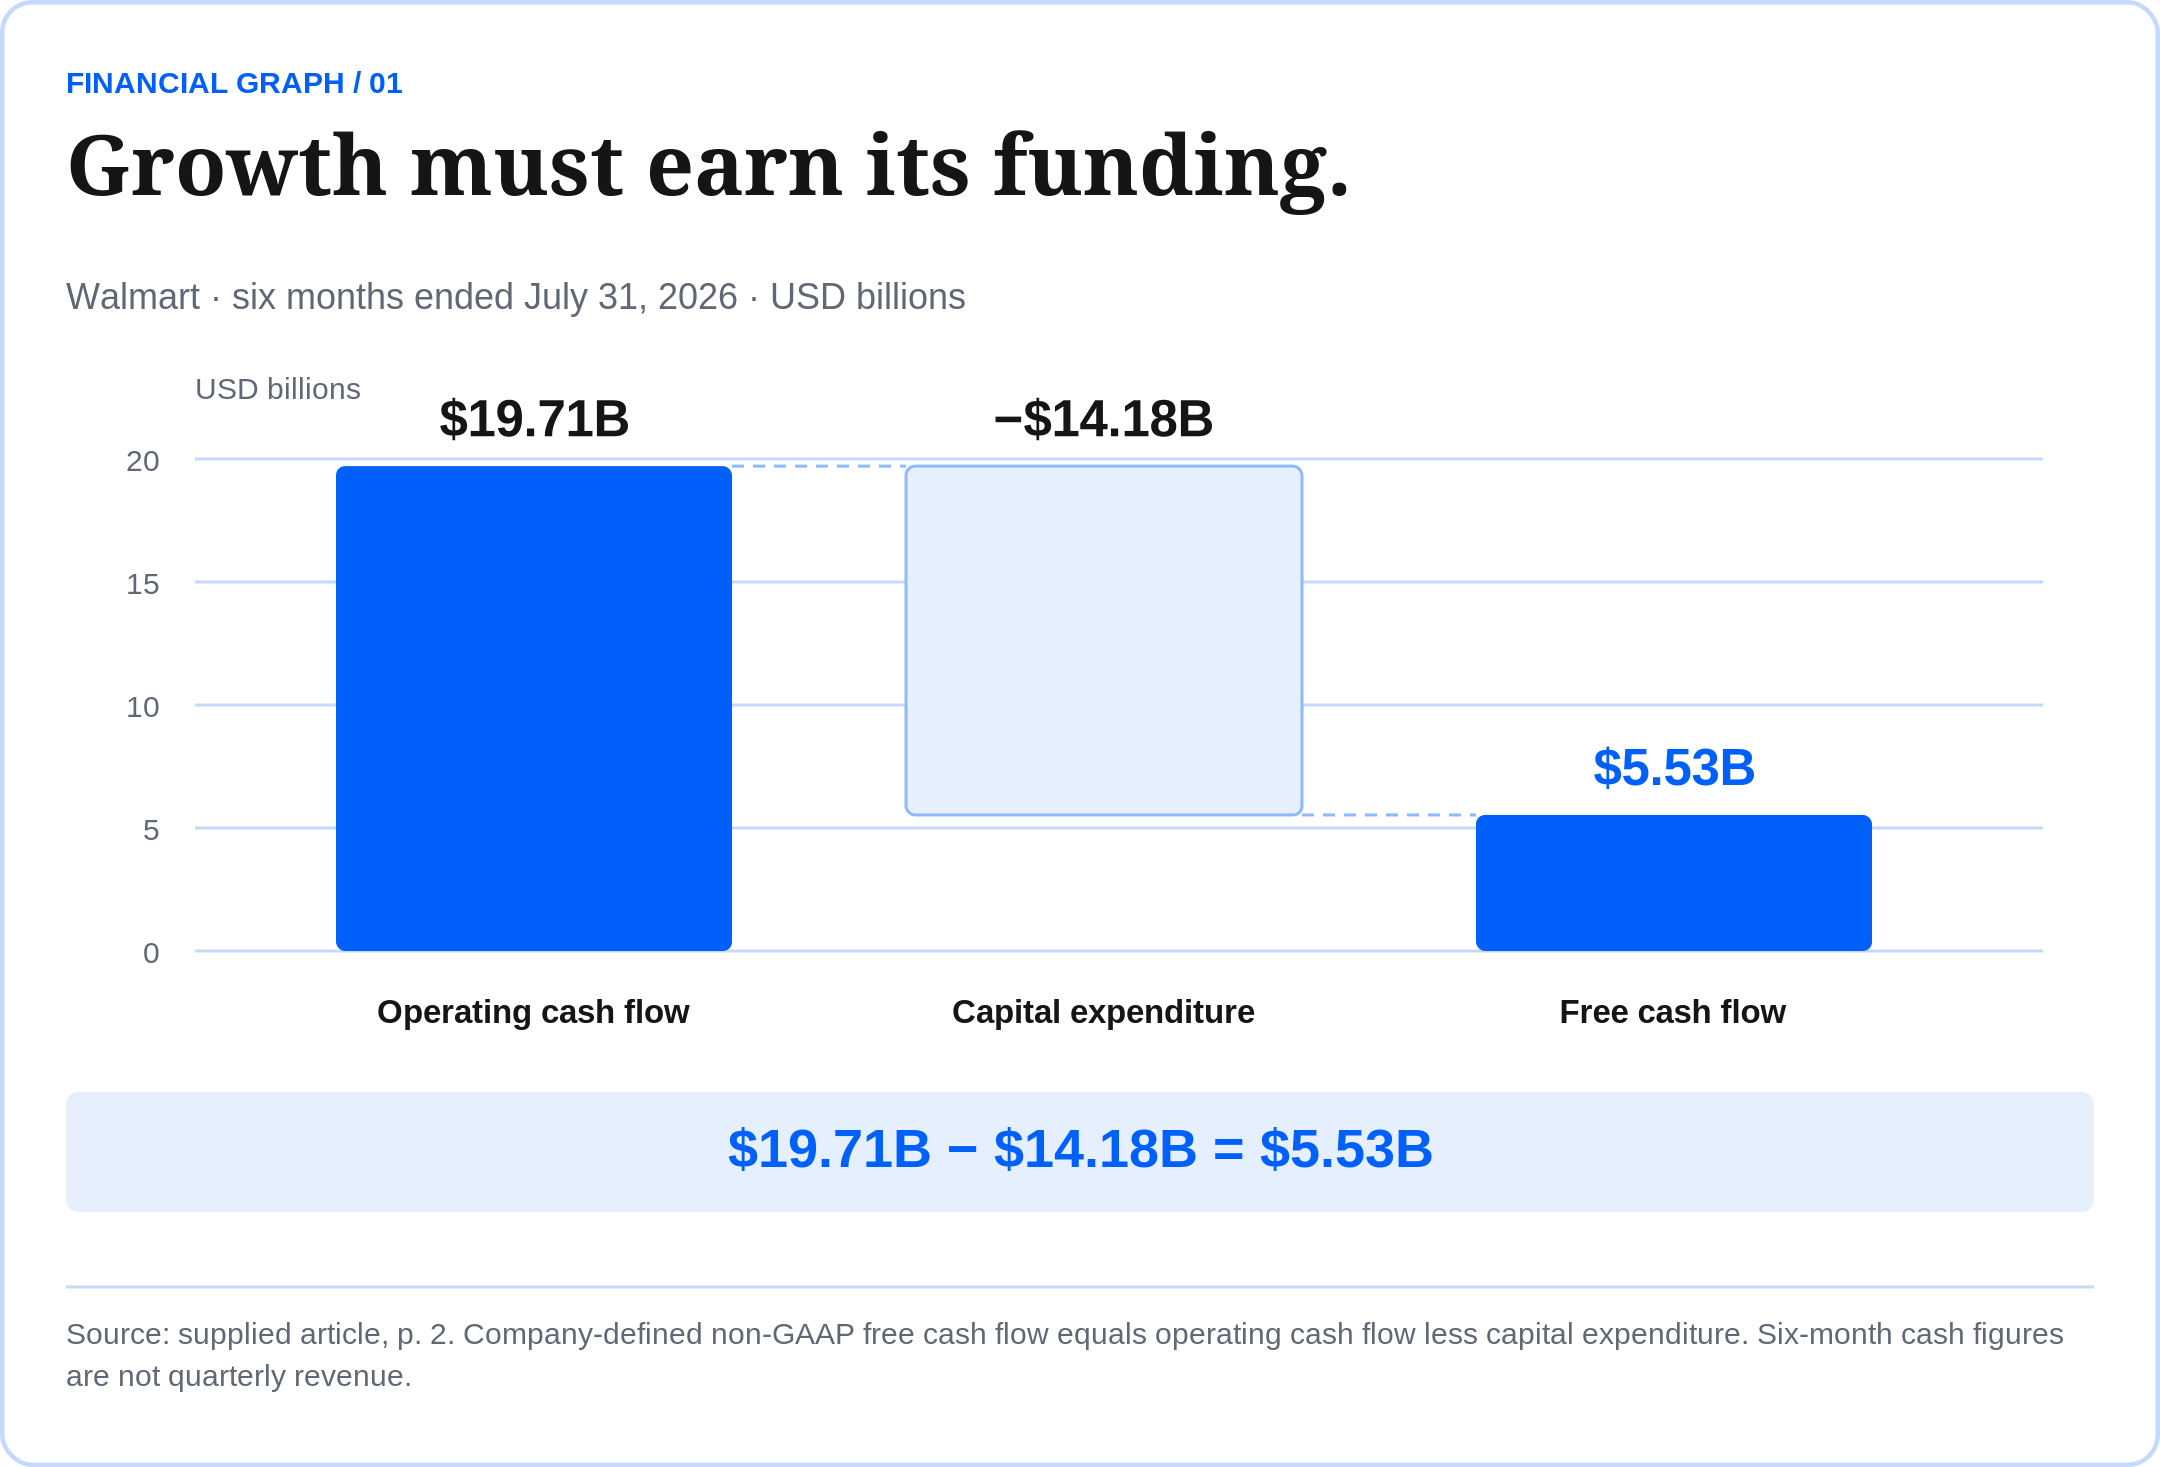
Growth must earn its funding.
More online orders create revenue, but picking, delivery, inventory and facilities require money. Walmart reported higher operating cash flow over six months while free cash flow declined as capital expenditure increased. The calculation above uses the company's definition.
Quarterly operating-income growth also benefited from tariff refunds. Separate that contribution from recurring operating improvements. Membership and advertising can broaden the profit mix, but their contribution should be assessed alongside the core shopping business.
Our investment interpretation: WMT deserves research if stronger customer relationships and better fulfillment economics can support lasting cash generation. Before buying, compare the valuation with sustainable earnings after the investment required to keep the proposition competitive.
Quarter ended July 31, 2026. Cash-flow comparison covers six months; free cash flow is a company-defined non-GAAP measure: operating cash flow less capital expenditure. Comparisons are year over year. Reporting periods differ across this edition.
03 / COCA-COLA / KO A familiar choice. |  |
A small purchase, repeated across customers and occasions, can support a substantial business. The source of growth still matters.
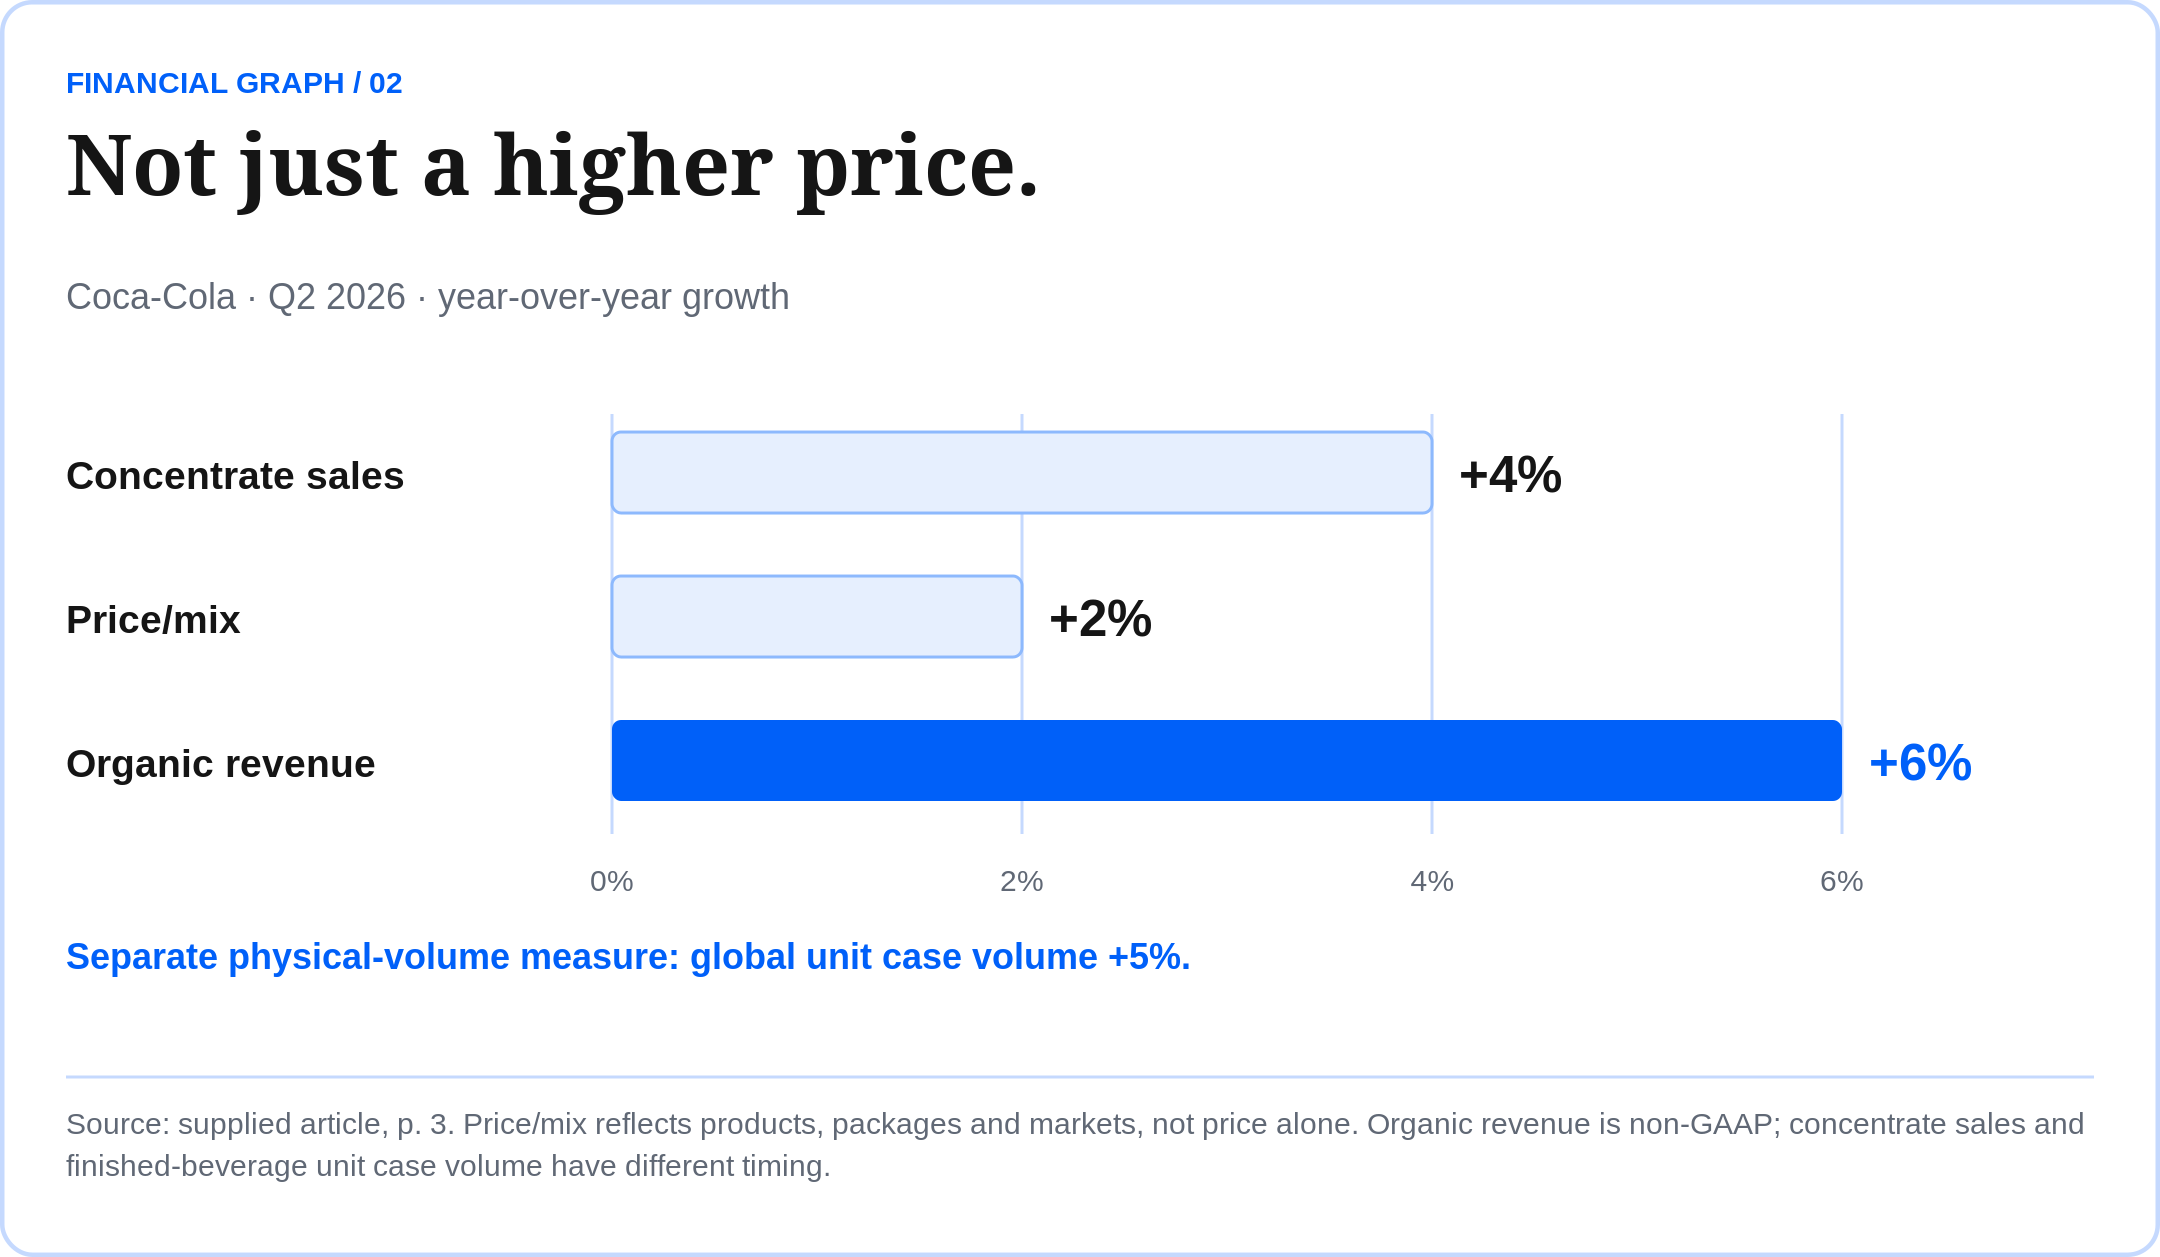
+5% Q2 2026 global unit case volume | +6% Organic revenue / non-GAAP | 34.9% Reported operating margin |
The brand must keep its place.
A recognizable brand can be valuable when shoppers become selective. The customer may protect a familiar affordable treat while reconsidering larger expenses. But loyalty has to survive the next purchase decision; it does not grant unlimited pricing power.
Coca-Cola's verified second-quarter results showed physical beverage volume growing alongside revenue. Net revenue rose 7% to $13.4 billion. The organic increase came from concentrate sales and price/mix, rather than price alone. Finished-beverage volume and concentrate shipments differed because of timing.
A hypothetical shopper can respond to higher prices by changing pack sizes, switching brands or waiting for a promotion. Investors should therefore look at the combination of volume, mix and margins. Revenue growth without those details leaves the commercial story unfinished.
Affordability meets profitability.
Price/mix includes the combination of products, packages and markets; it is not a pure price increase. Organic revenue is also a company-defined non-GAAP measure. Keep these distinctions intact when comparing the latest evidence with earlier periods.
Our investment interpretation: demand that survives a sensible pricing strategy gives a stronger foundation for future earnings than repeated price increases that gradually push customers away. Distribution, execution and spending discipline must support the brand.
For KO, examine volumes, operating margins and cash generation together. A familiar name can deserve a premium, but the stock price may already assume years of reliable performance. This section uses Q2 figures; an unverified Q3 release is not treated as an achieved result.
Q2 ended July 3, 2026; year-over-year comparisons. Unit case volume describes finished beverages sold by the company and bottling partners. Organic revenue uses concentrate sales. Q3 was scheduled for Oct. 27; no new figures are assumed here.
|
04 / VISA + MASTERCARD / V + MA Behind the payment, |  |
The purchase is visible. The network connecting the merchant and financial institutions is easier to overlook.
+14% V / VISA · reported net revenue growth · fiscal Q3 2026, ended June 30 | +14% MA / MASTERCARD · reported net revenue growth · Q2 2026, ended June 30 |
Visa: activity beyond dollars.
Visa reported $11.6 billion of net revenue. Payments volume increased 10% in constant dollars, processed transactions grew 10%, and cross-border volume excluding intra-Europe increased 12% in constant dollars. These measures illuminate different parts of commerce.
Spending value describes the amount moving through the network. Transaction counts show activity frequency. International payments offer another perspective. Together they illuminate commerce without measuring every household's financial health.
Visa does not issue cards or extend credit to account holders. Its economics differ from a bank earning interest on card balances. Research spending, customer relationships, incentives and services to understand the network business.
For V, compare profitable growth with valuation. These figures precede the scheduled October 27 year-end release; no unverified results are assumed.
Mastercard: a broader service mix.
Mastercard reported $9.3 billion in net revenue, up 14%, or 12% on a currency-neutral basis. Switched transactions increased 9%. Value-added services and solutions revenue grew 20%, or 18% excluding currency effects.
That services business makes the research broader than counting purchases. Assess whether services deepen customer relationships and produce attractive incremental profit. Faster sales in one category do not automatically establish stronger cash generation across the whole company.
The network model also differs from card lending: issuing institutions manage the cardholder credit relationship. Settlement, commercial and regulatory considerations remain relevant. This distinction identifies the economics to examine.
For MA, compare activity, services, margins and valuation. Its next earnings call is October 29. Owning both networks creates overlapping exposure; two positions are not automatically two independent investment cases.
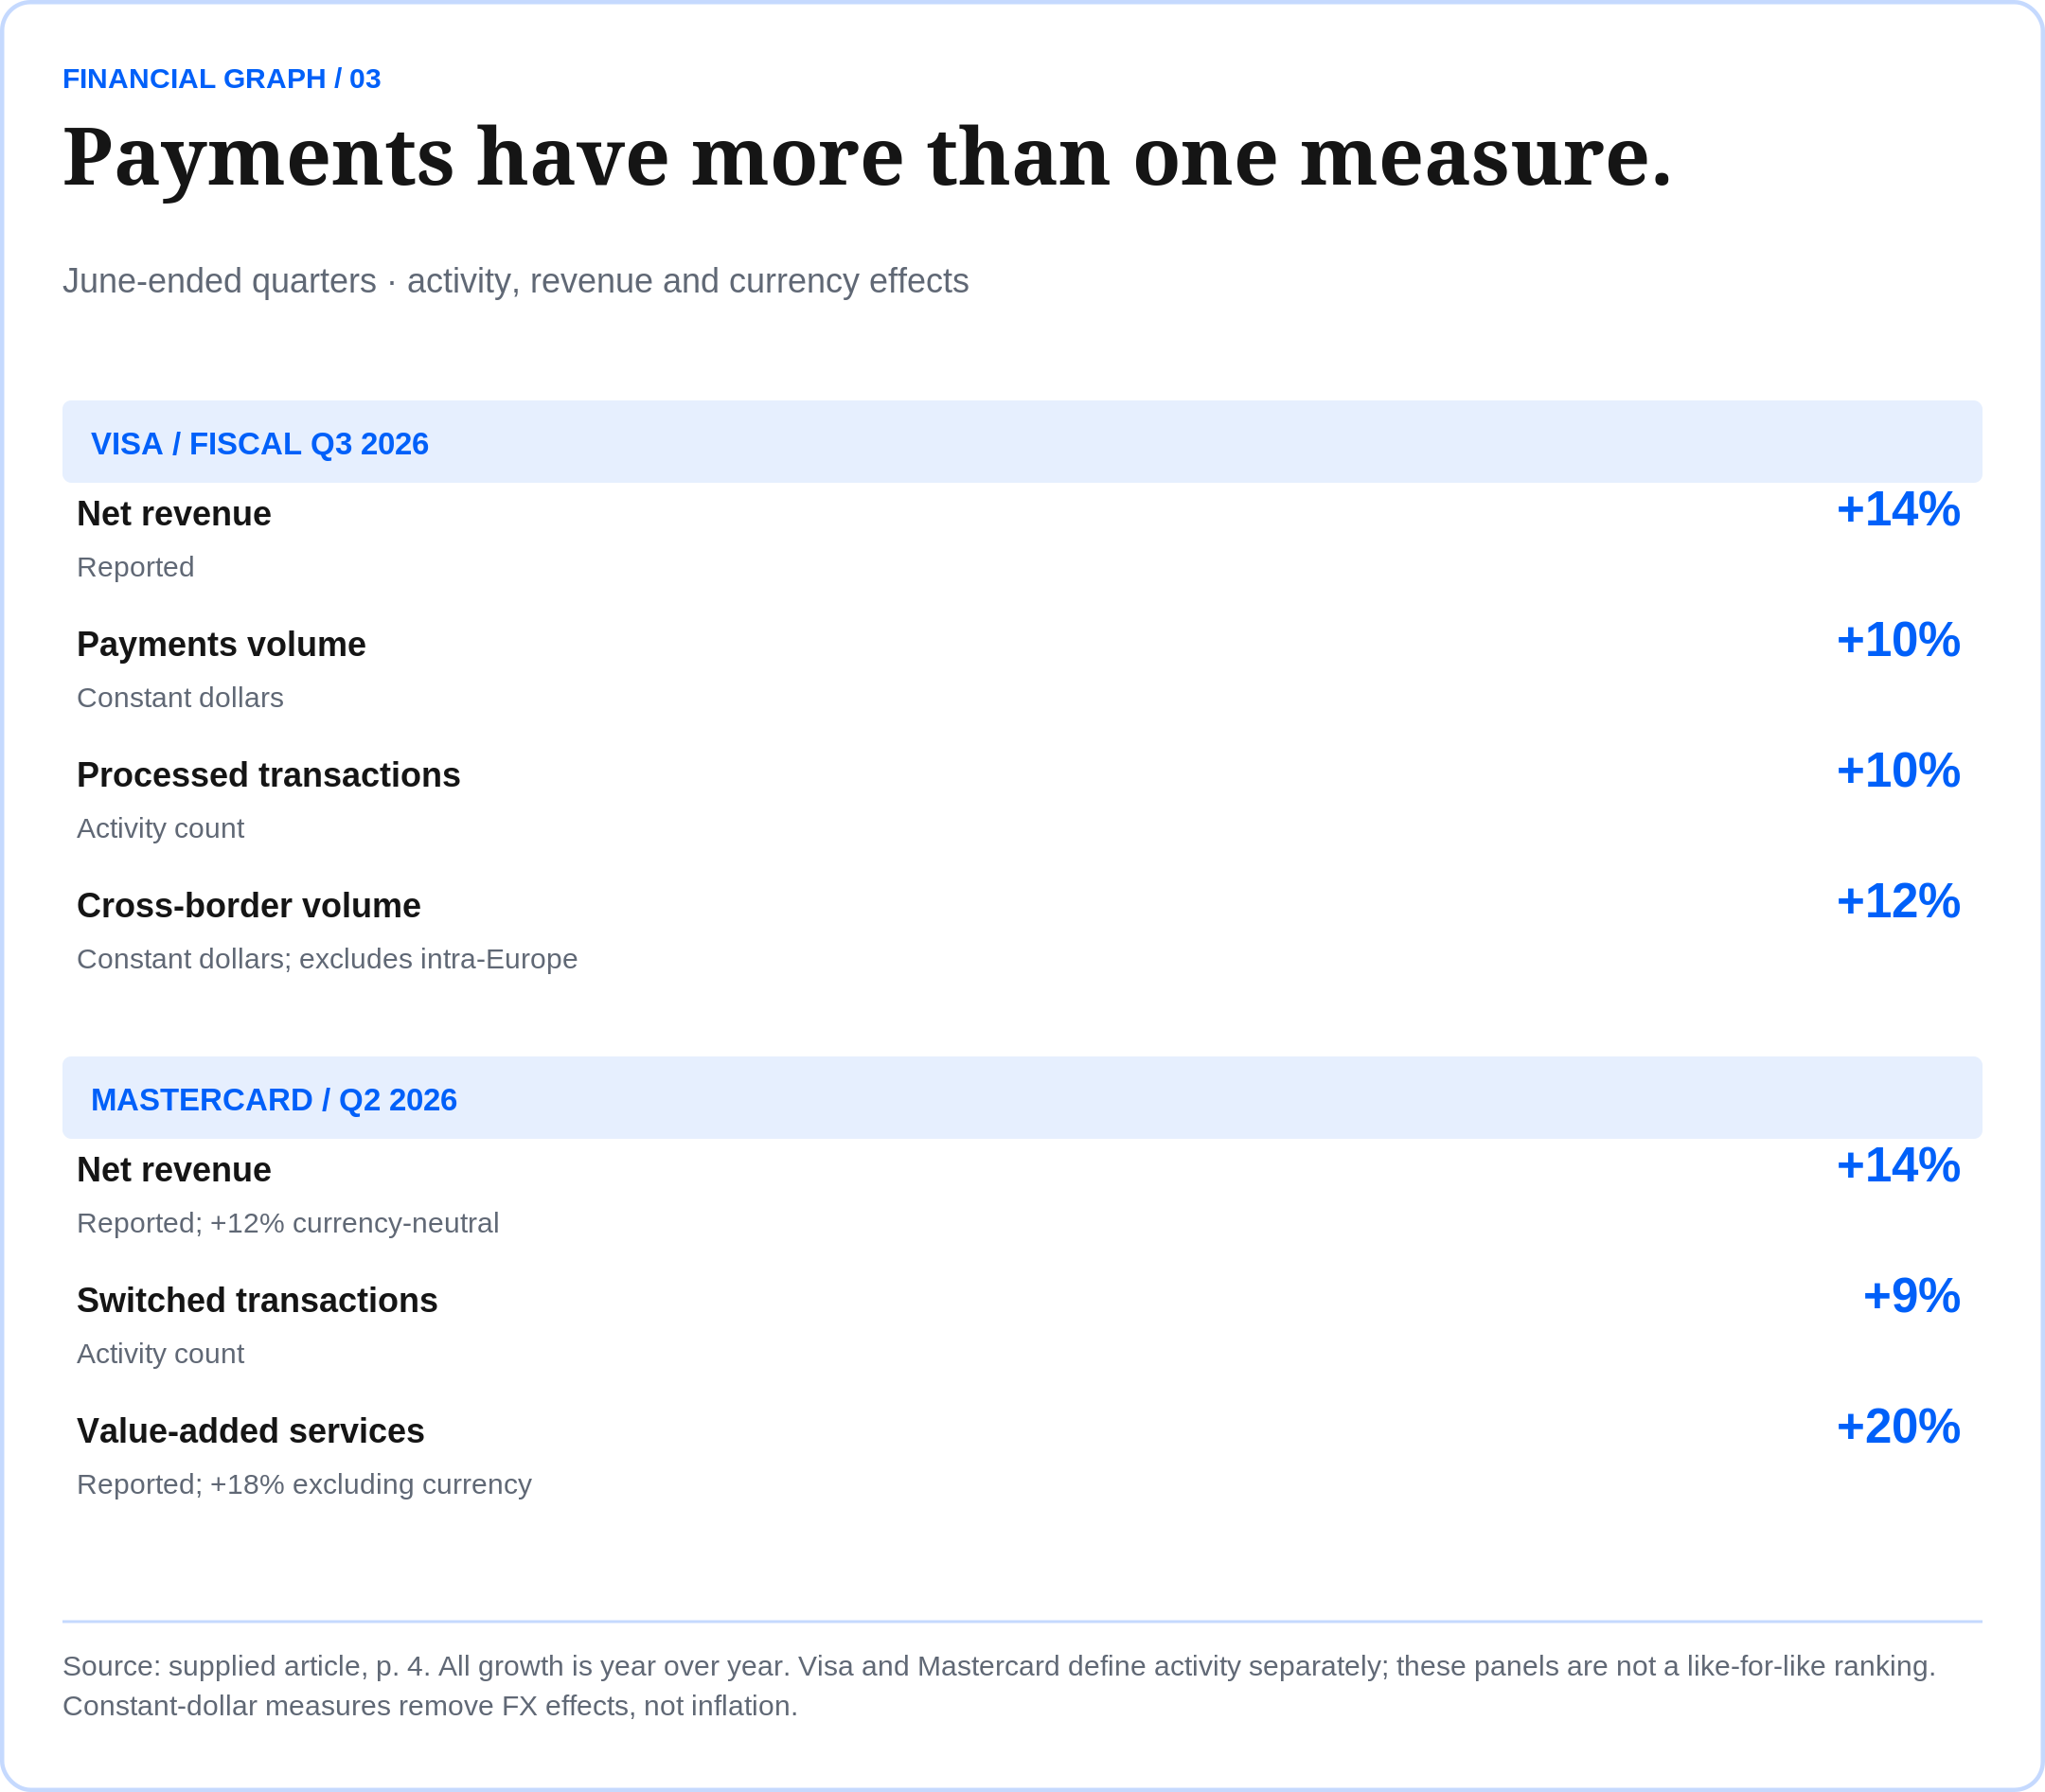
June-quarter results; growth is year over year. Constant-dollar/currency-neutral measures remove exchange-rate effects, not inflation. V and MA define activity metrics separately. Visa FY26 results were scheduled for Oct. 27 after the U.S. market close.
Visa / fiscal Q3 · Mastercard / Q2 · Network model · MA next report
05 / UPS / THE PACKAGE AND THE PROFIT Revenue is rising. |  |
UPS's October 27 release shows why shipping revenue, package activity and profitability need separate explanations.
$22.9B Q3 2026 revenue / +6.7% | +6.1% U.S. revenue per piece | −3.3% U.S. average daily volume |
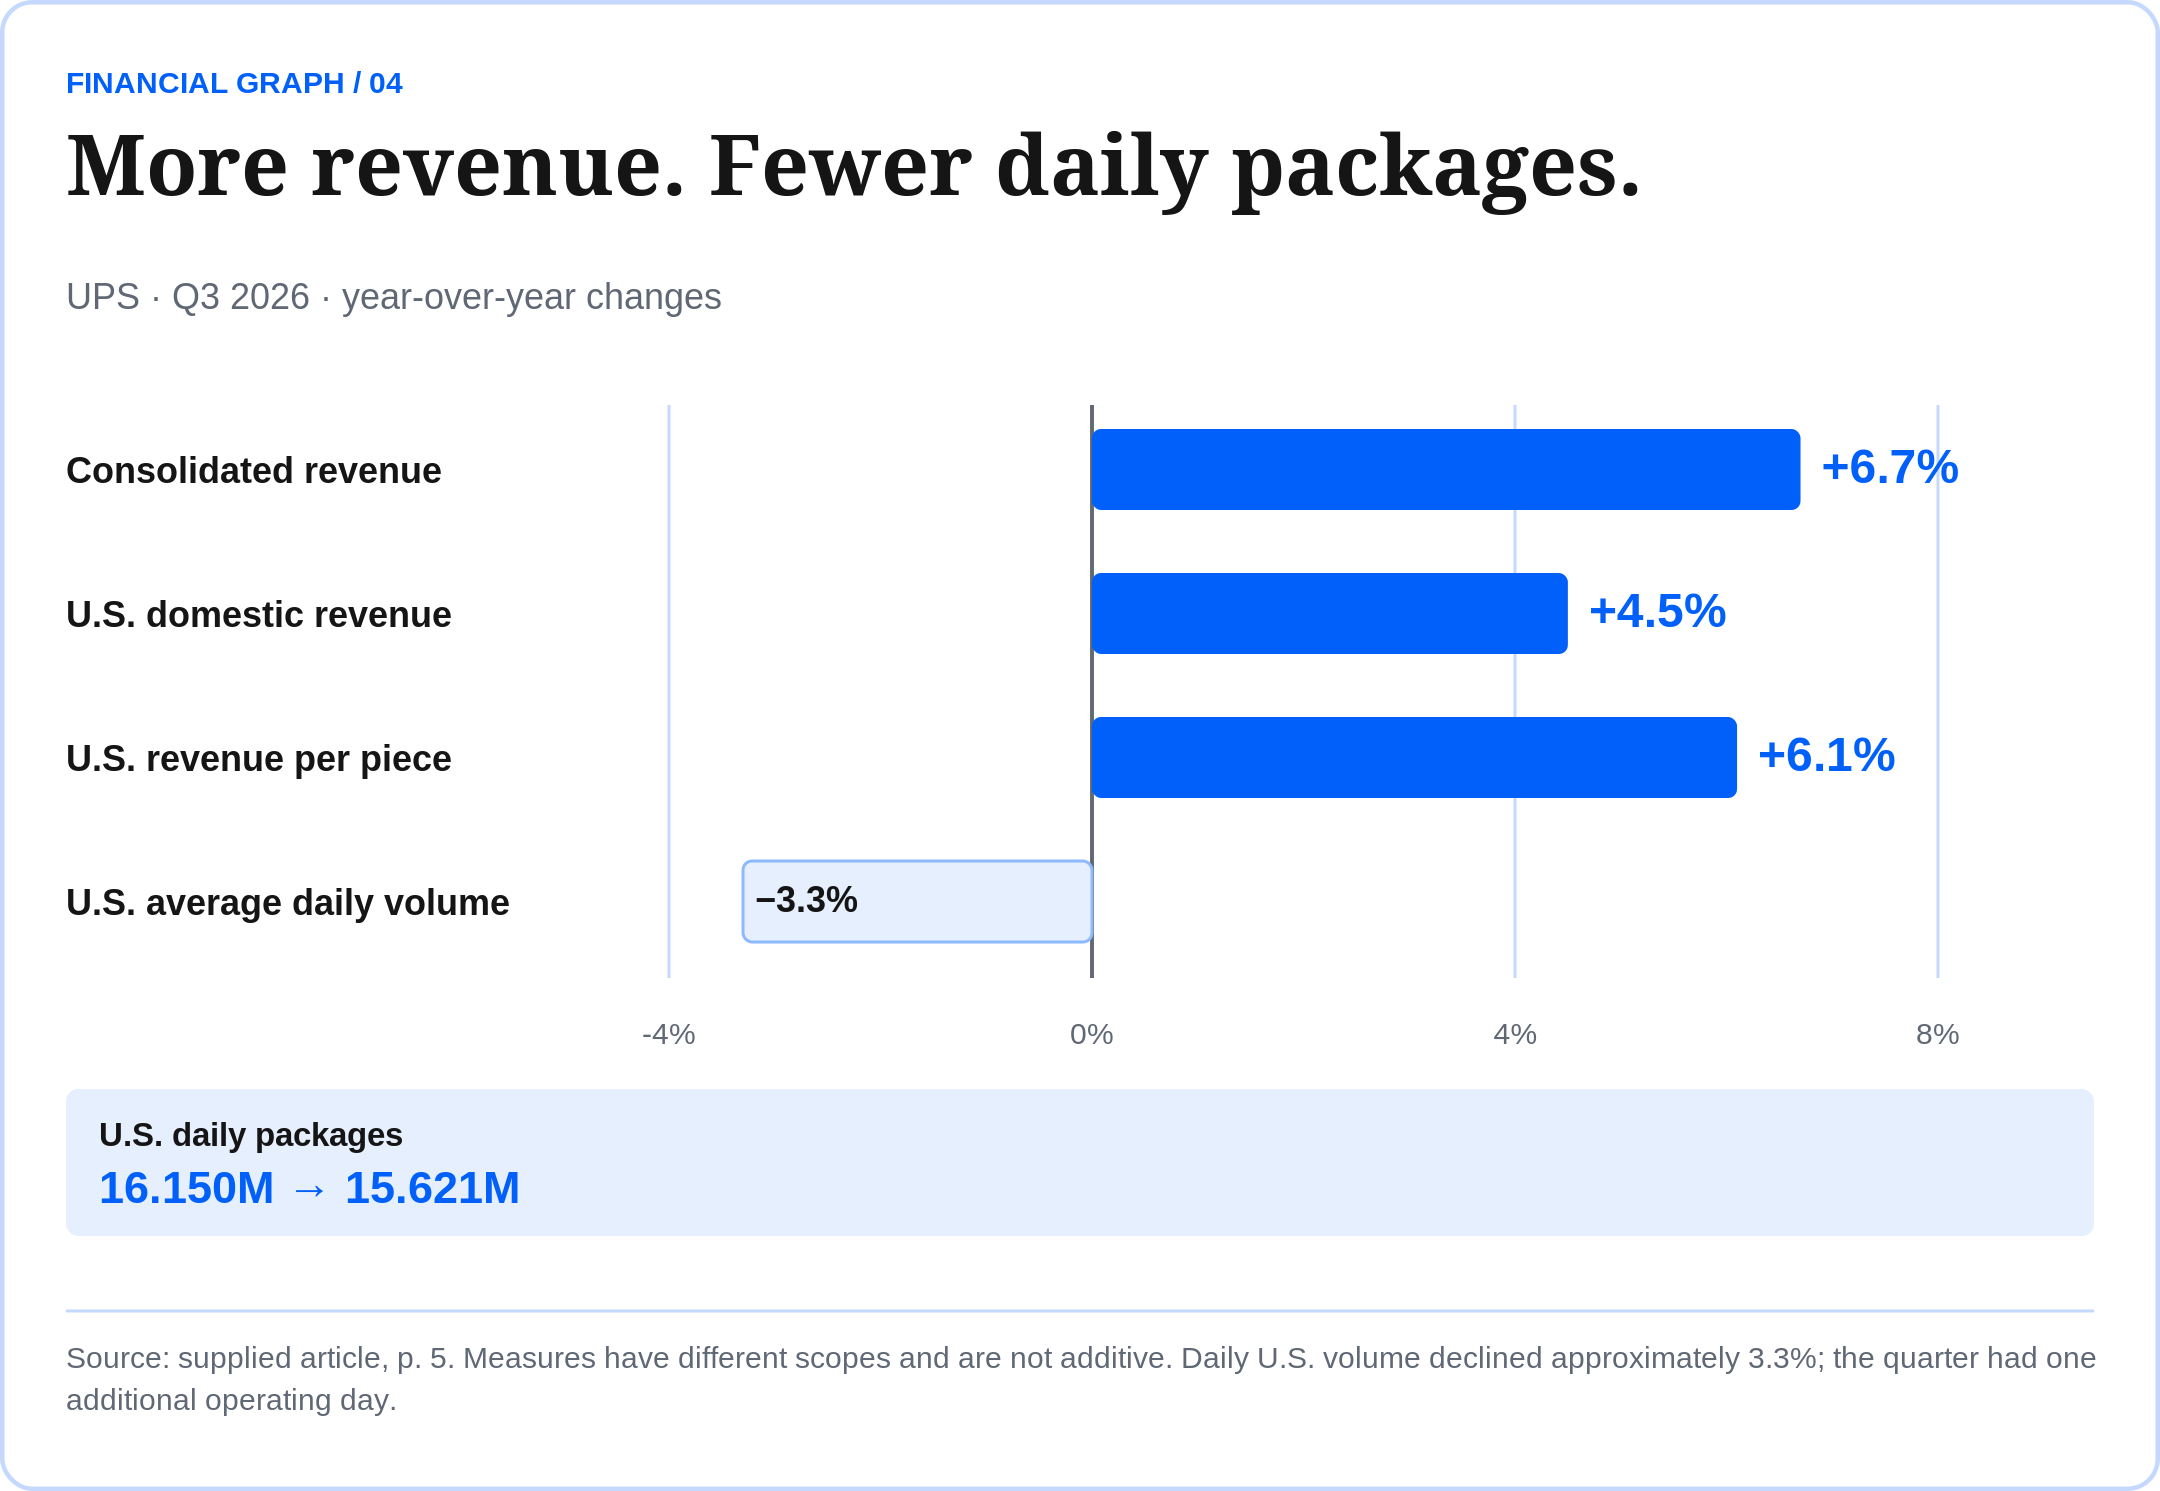
More revenue, fewer packages.
U.S. domestic revenue grew 4.5%, supported by higher revenue per piece. Average daily domestic volume fell from 16.150 million to 15.621 million, a decline of approximately 3.3%. The quarter also had one more operating day than a year earlier.
This is why revenue cannot serve as a package counter. Pricing, service mix, surcharges and operating days affect the comparison. Company choices matter too: UPS's earlier release described a deliberate reduction in Amazon business and network reconfiguration.
Our interpretation: a carrier can improve customer economics while handling less volume. The evidence must establish whether prices and mix cover costs and whether the network is appropriately sized. A smaller workload helps little if unused capacity absorbs the benefit.
Profit and cash complete the test.
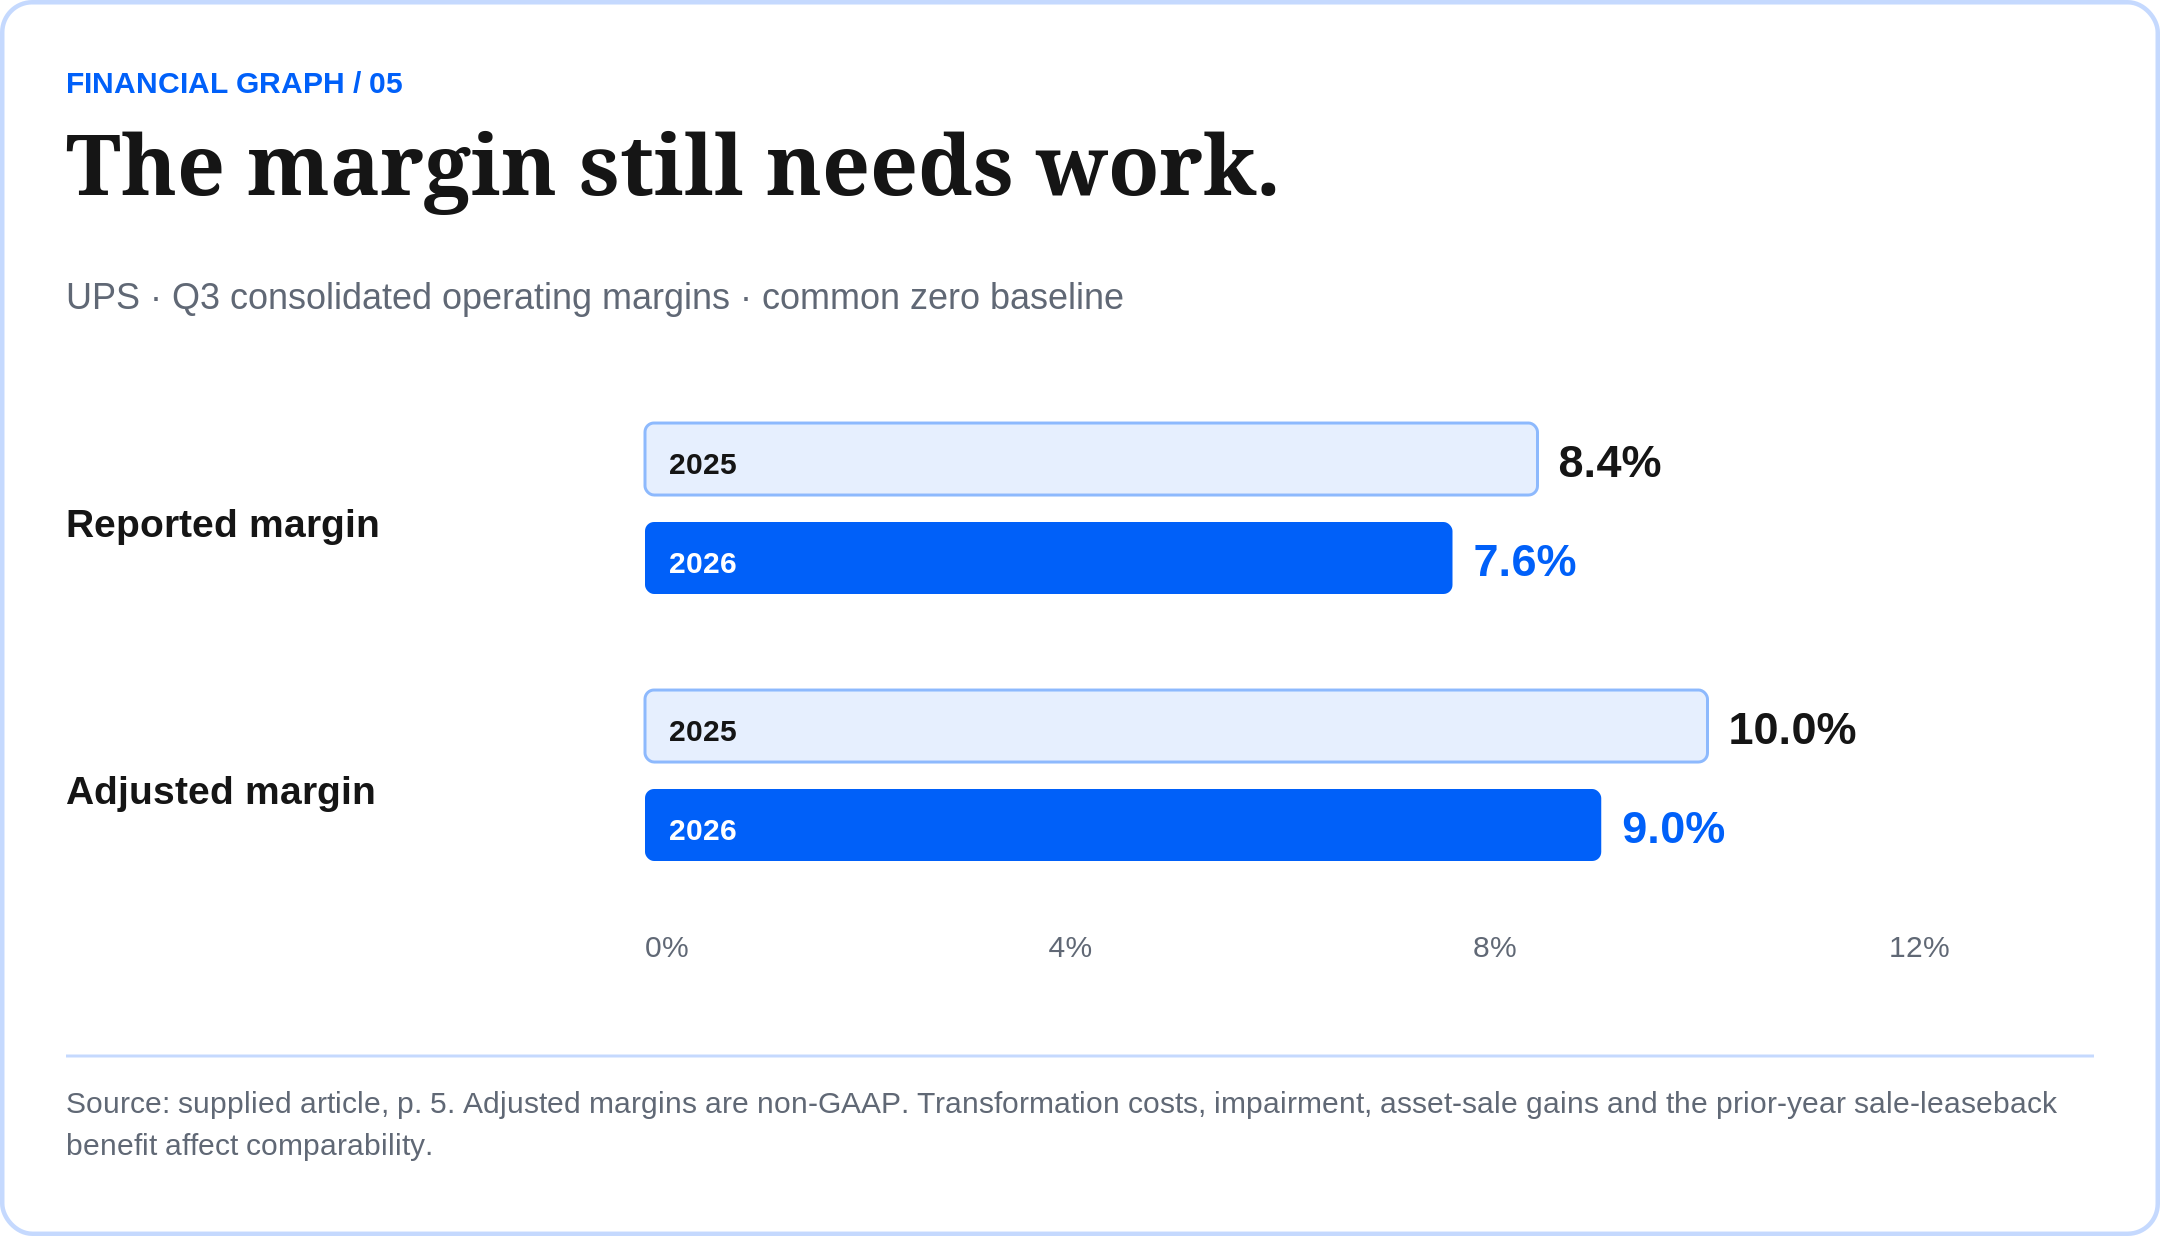
Consolidated reported margin fell from 8.4% to 7.6%; adjusted margin was 9.0%, versus 10.0% a year earlier. Adjustments included transformation costs, an impairment and an asset-sale gain. The prior year also included a sale-leaseback benefit. Comparisons need that context.
UPS raised its full-year outlook, including a company-defined adjusted free-cash-flow target of approximately $6.1 billion. Forecasts still need delivery. A shareholder should examine required investment, pension funding and cash distributions alongside earnings.
For UPS, we would research cost per piece, network utilization and recurring cash generation before judging the valuation or dividend appeal. A high yield cannot replace that work. The investment case improves when operational execution earns the cash needed to support it.
Quarter ended September 30, 2026. Daily-volume decline is our calculation. Adjusted measures are non-GAAP. Full-year cash-flow target is management guidance, not an achieved result or a guarantee of dividend coverage.
UPS / Q3 release + reconciliations · UPS / Q2 network context
06 / THE INVESTOR CALL / RESEARCH BOARD Five businesses |  |
Everyday commerce can support durable businesses. Each investment still needs its own evidence and valuation.
Walmart Retail + fulfillment U.S. e-commerce +24%; cash needs rising. Watch: traffic, delivery economics and cash. |
Coca-Cola Brands + distribution Q2 beverage volume +5%; price/mix +2%. Watch: demand, affordability and margins. |
Visa Payments network June-quarter processed transactions +10%. Watch: new results, incentives and valuation. |
Mastercard Payments + services Q2 revenue +14%; services +20%, reported. Watch: Oct. 29 results and services economics. |
UPS Delivery + logistics Q3 revenue +6.7%; daily U.S. volume lower. Watch: network costs and recurring cash. |
What earns a place in the portfolio?
Invest where durable demand, competitive strength and cash generation justify the price. Wait where expectations outrun evidence or temporary benefits flatter earnings. This research list does not establish five buy recommendations. Research the business. Understand the cash. Pay a price the evidence can support.
Questions or a business to investigate? [email protected]
EXPLORE YOUR TRADING PLATFORM
| Fidelity | Charles Schwab |
| Interactive Brokers | Tiger Trade |
Availability depends on country, account and permissions. Research candidates are not endorsements of a platform.
Research the business. Understand the cash.
| Subscribe now for free | Get in touch with our team |
|
Production note. This is a design edition of the supplied October 28, 2026 article, prepared October 27. Figures, company claims and source-link destinations are retained as supplied, not independently verified or updated. The visuals use only the supplied figures; reporting periods, non-GAAP definitions and forecast qualifications remain identified.
 Research that matters. Insight you can trust. |  |
