
THE INVESTOR CALL / SEMICONDUCTORS + AI / OCTOBER 8, 2026
|
01 / THE SAMSUNG YOU THOUGHT YOU KNEW Samsung: 9× |  |
Forget the televisions. Samsung’s next chapter is being written inside the global AI economy.
Everybody knows Samsung. The screen in the living room. The phone in a pocket. The appliances at home. Yet the business driving its extraordinary earnings is largely invisible to the people who use those products.
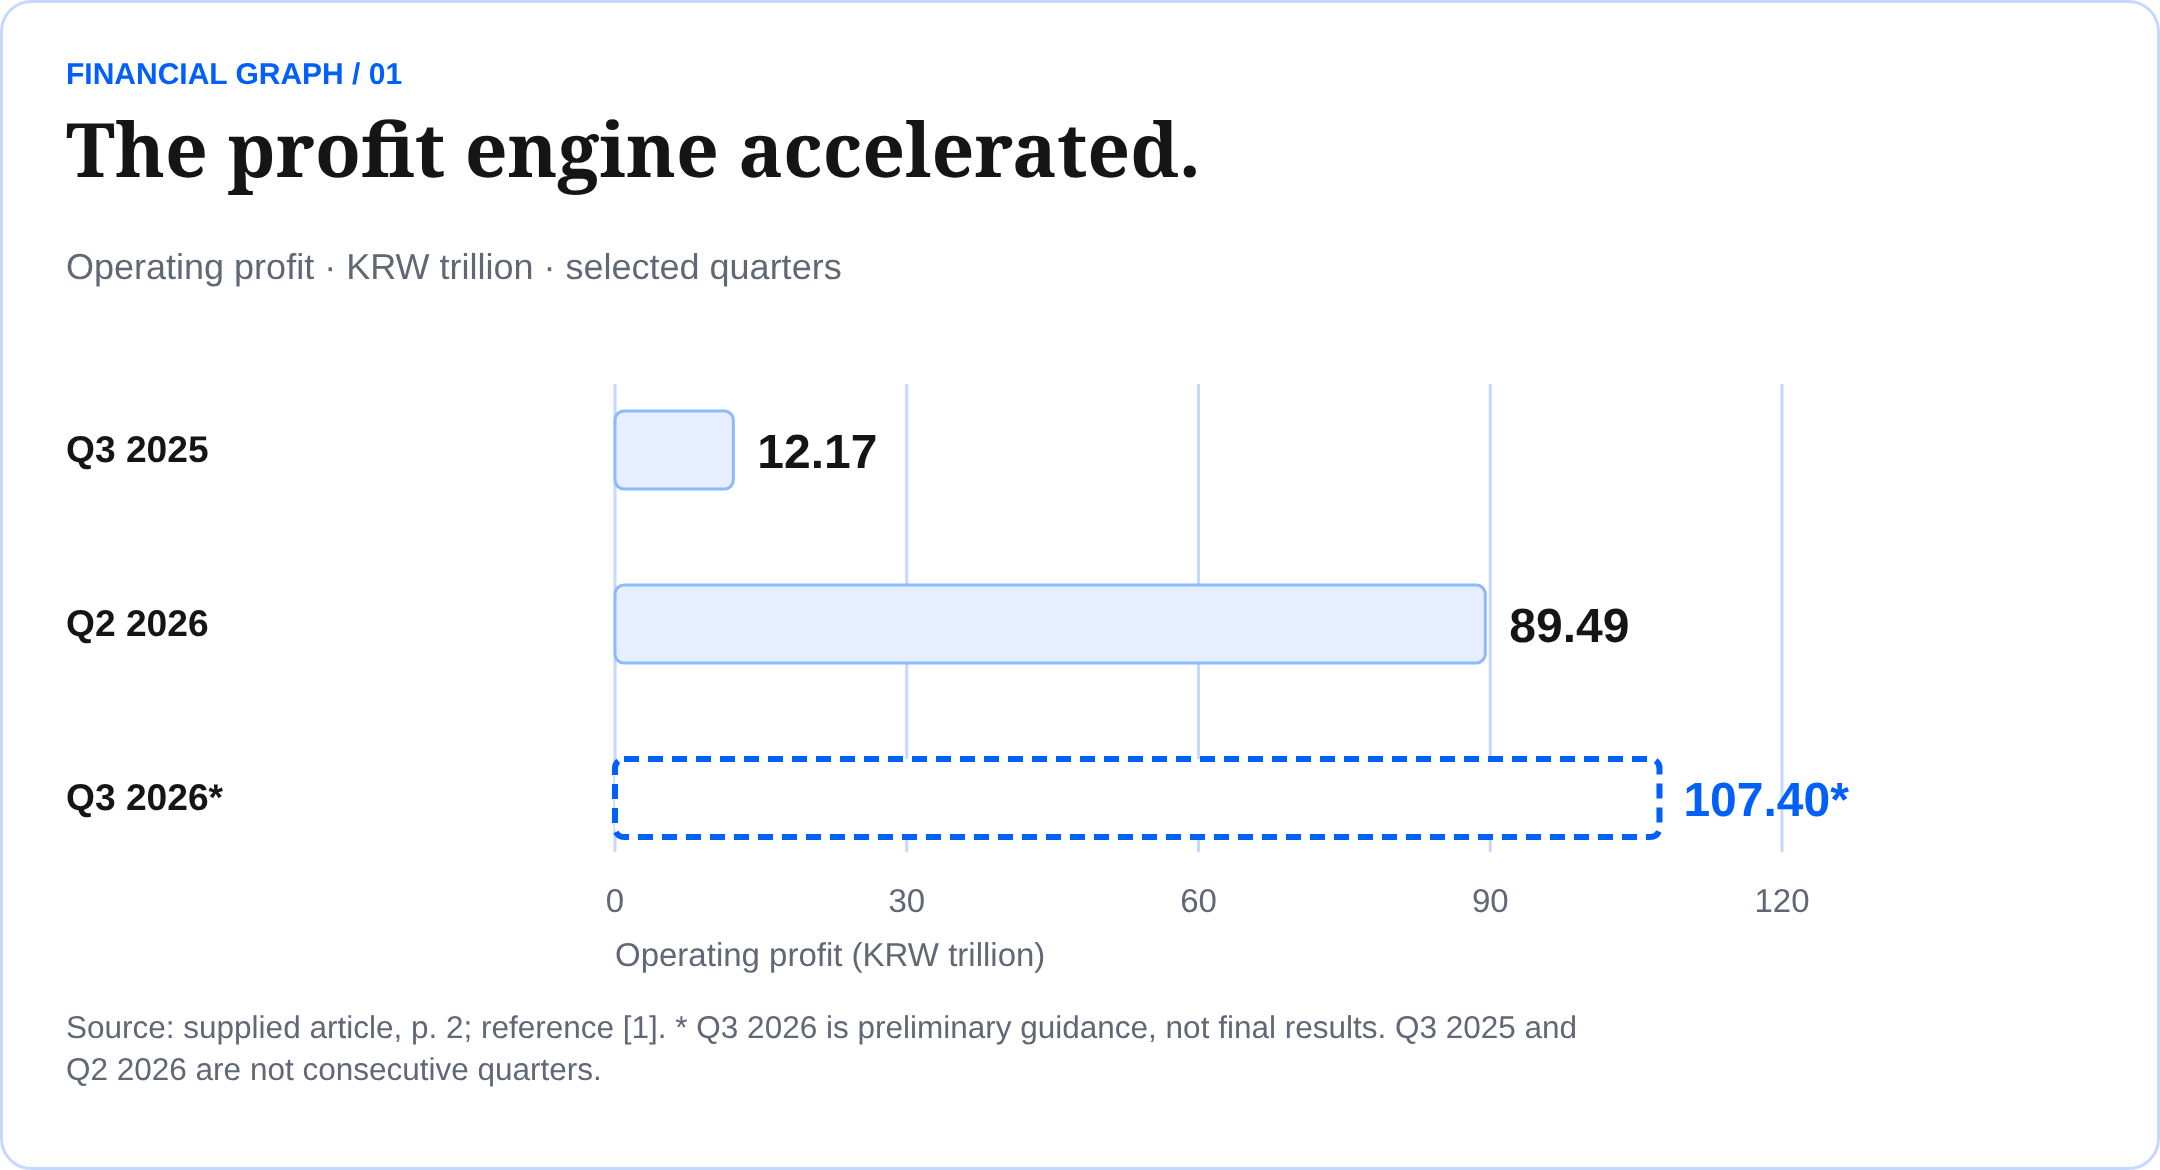
On October 8, Samsung Electronics guided to third-quarter revenue of KRW 195 trillion and operating profit of KRW 107.4 trillion. That is approximately 8.8 times the profit of Q3 2025, rounded to 9× in our headline. These are preliminary estimates, not final results. [1]
|
|
|
The familiar name. The unfamiliar economics.
Samsung’s Device eXperience division serves consumer markets; Device Solutions houses memory, foundry and system-chip operations. AI infrastructure creates demand for the memory and storage that keep expensive processors working. That gives Samsung a second story beyond the consumer brand. [2]
Our investment question is what comes next. Strong demand can lift earnings. Scarce capacity can lift prices. Better products can improve margins. Those forces can work together, but they do not all last equally long.
What if the most interesting part of Samsung is the business most consumers never see? |
Inside this edition: the numbers, the AI supply chain, five stocks to watch and three scenarios for 2027.
02 / FOLLOW THE MONEY A bigger business. |  |
The size of the profit matters. The quality of the profit matters more.
KRW TRILLION | Q3 2025 | Q2 2026 | Q3 2026* |
|---|---|---|---|
Revenue | 86.06 | 171.50 | 195.00 |
Operating profit | 12.17 | 89.49 | 107.40 |
Operating margin¹ | 14.1% | 52.2% | 55.1% |
* Preliminary guidance. ¹ Operating profit / revenue; TIC calculations. Revenue growth: +126.6% YoY, +13.7% QoQ. Operating profit: +782.5% YoY, +20.0% QoQ. [1]
Where the money is coming from
Samsung’s Q2 release reported DS revenue of KRW 127.5 trillion and operating profit of KRW 89.2 trillion. Higher memory prices and a greater server-product mix supported earnings; HBM4 sales scaled up. Mobile and Networks generated KRW 33.2 trillion of revenue but a KRW 0.7 trillion operating loss. The consumer and chip businesses can respond differently to the same component-price cycle. [2]
Cash is the next test
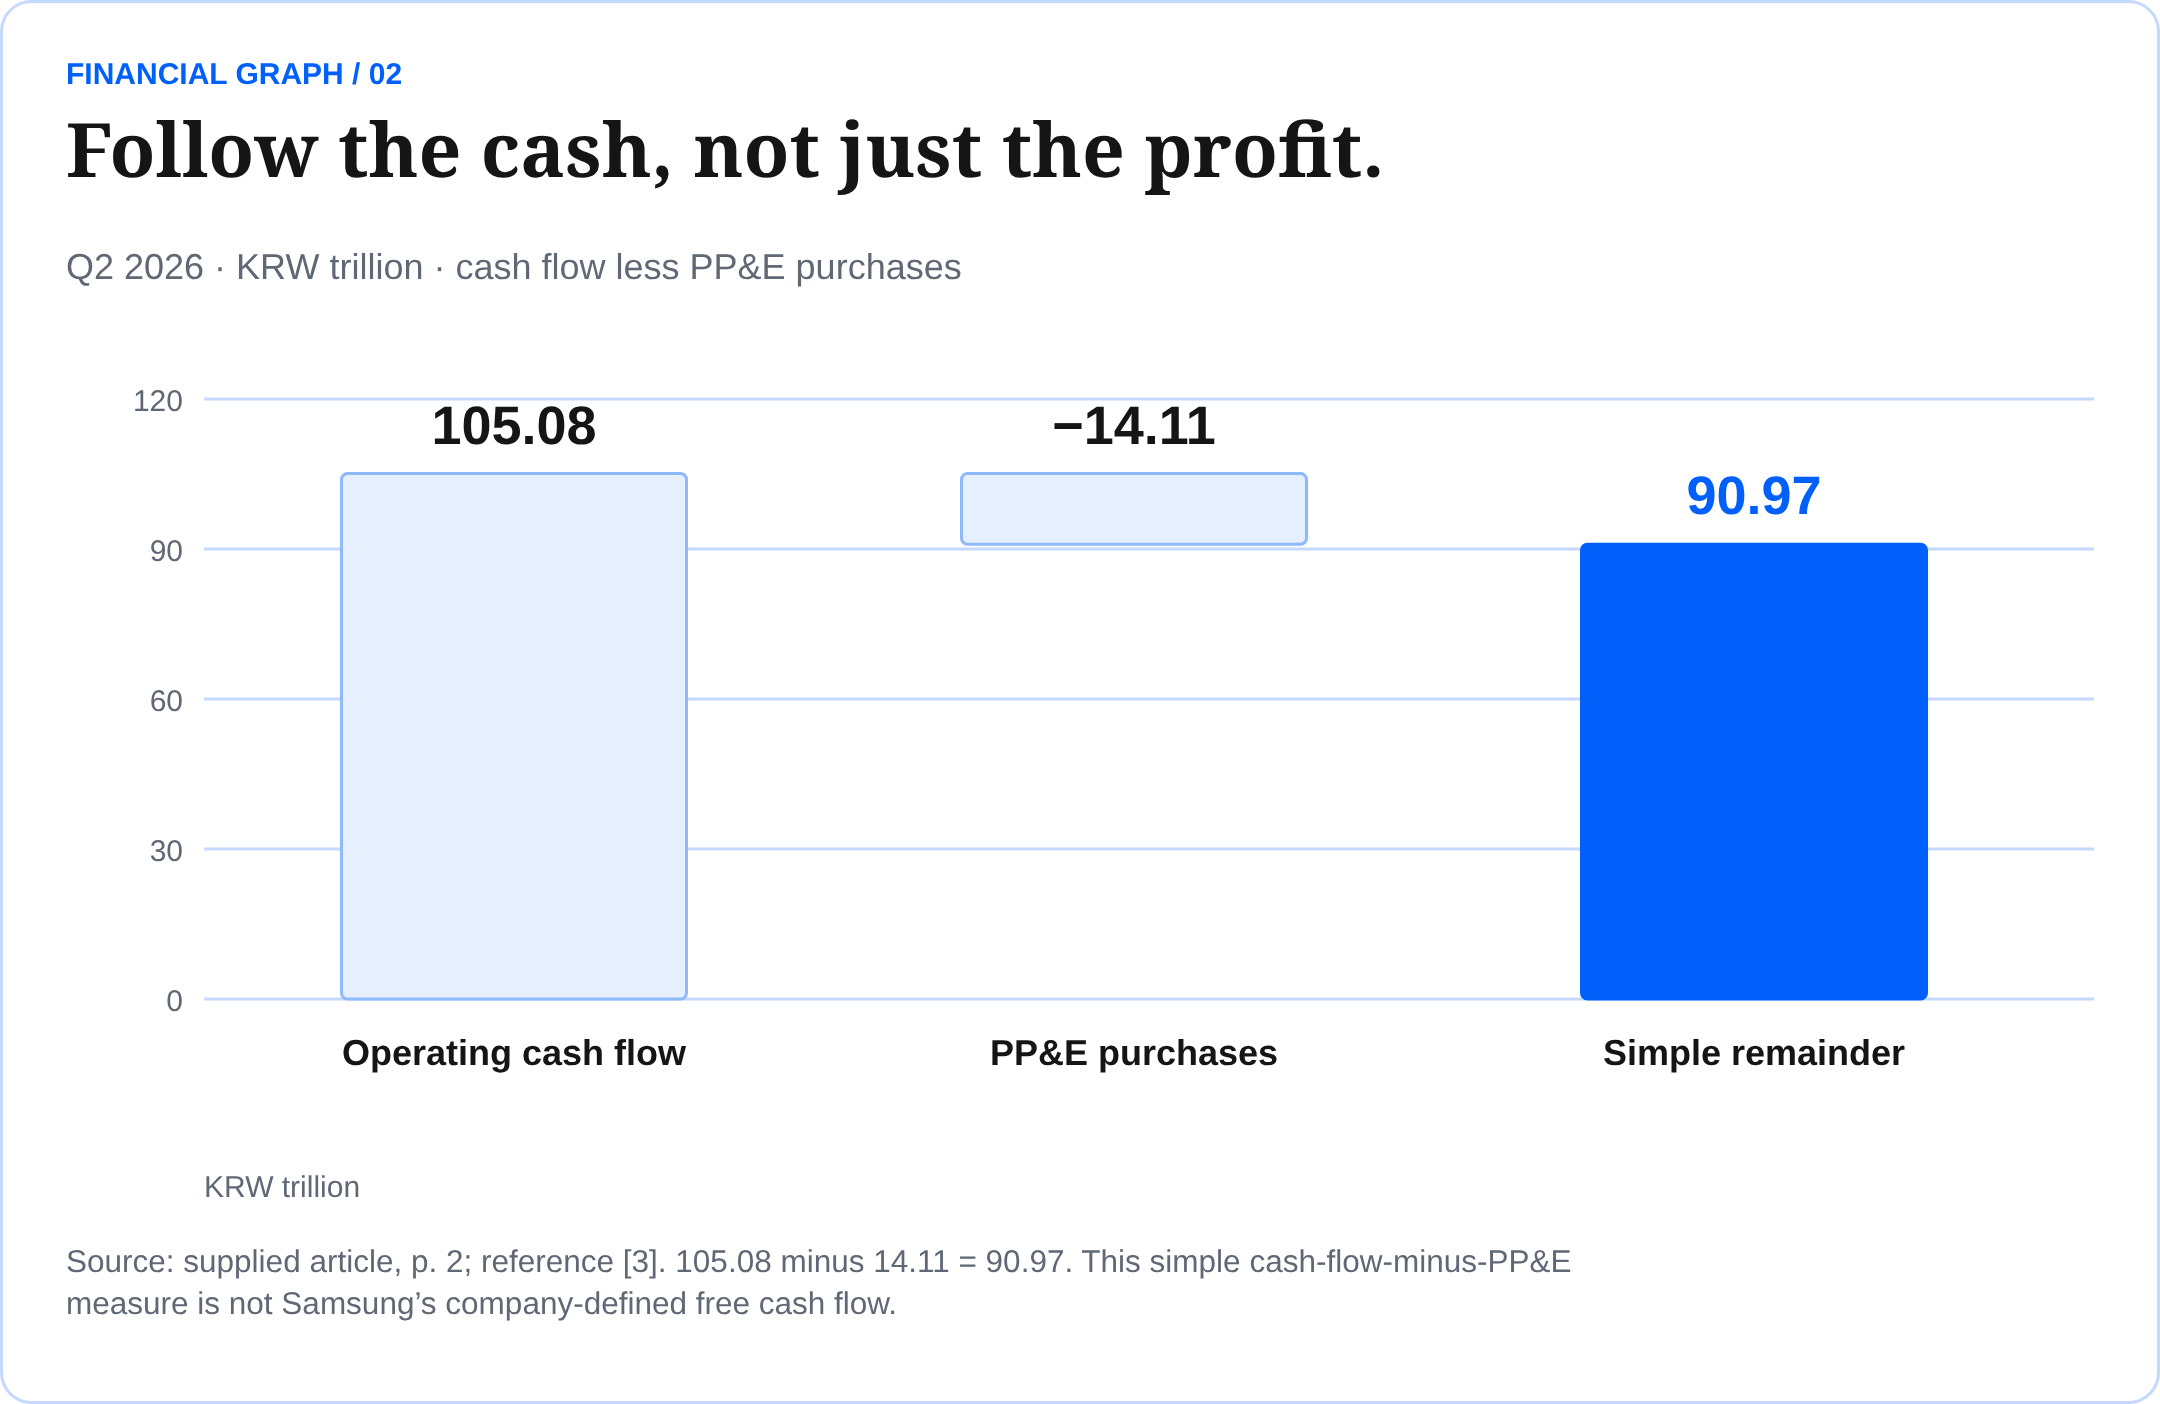
Q2 operating cash flow was KRW 105.08 trillion; purchases of property, plant and equipment were KRW 14.11 trillion. Subtracting the latter gives KRW 90.97 trillion, a simple cash-flow-minus-PP&E measure, not a company-defined free-cash-flow figure. Net cash was KRW 167.59 trillion at June 30. [3]
TIC INTERPRETATION A stronger product mix can improve the earnings base, while exceptionally high memory prices can amplify the cycle. The October 29 detailed results should reveal Q3 segment margins, shipment trends and cash conversion. Today’s headline guidance does not provide that breakdown. [4] |
03 / THE AI ENGINE NOBODY SEES The processor |  |
An AI system is only as useful as the data it can move, hold and retrieve.
Think of a processor as the engine and memory as its immediate supply of working material. An engine that waits for data is expensive idle capacity. Faster memory helps keep more of that computing investment productive. This is why the AI opportunity reaches well beyond the companies designing GPUs.
LAYER | WHAT IT DOES | SAMSUNG’S OPPORTUNITY |
|---|---|---|
HBM | Stacked DRAM close to an accelerator; moves large amounts of data quickly. | HBM3E and HBM4; performance, packaging and reliable volume. |
Server DRAM | Holds the working data used by server CPUs and applications. | High-capacity DDR5 and other server-memory products. |
NAND / enterprise SSDs | Stores models, datasets and information between workloads. | High-density storage and faster data-center SSDs. |
Foundry | Manufactures chip designs for customers, including logic base dies. | Manufacturing yields, advanced processes and capacity use. |
The commercial milestone has already happened
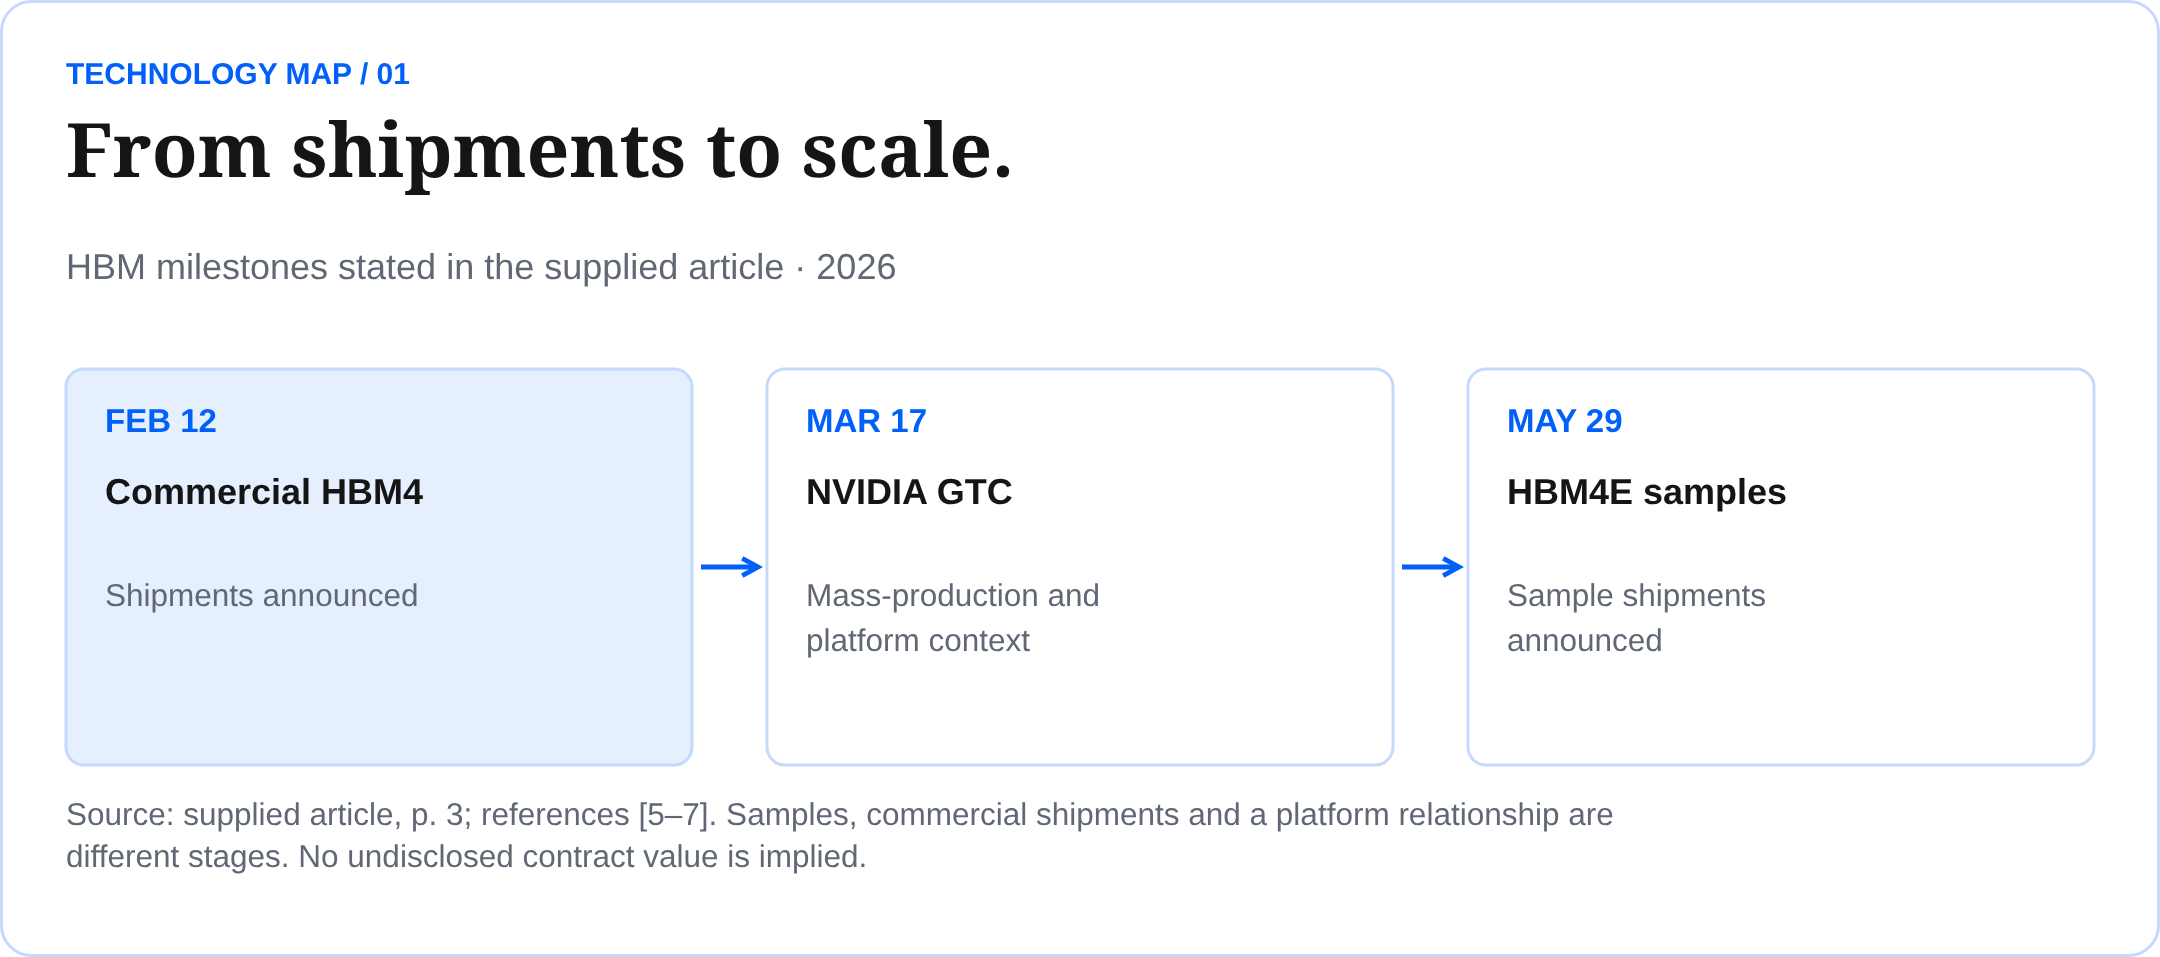
Samsung announced commercial HBM4 shipments on February 12, 2026. At NVIDIA GTC in March, it described HBM4 as being in mass production and designed for NVIDIA’s Vera Rubin platform. HBM4E sample shipments followed on May 29. Samples, commercial shipments and a platform relationship represent different stages; none establishes an undisclosed contract value. [5, 6, 7]
That changes what investors should ask. Qualification remains relevant for each customer and product, but the broader story is now about the scale of shipments, manufacturing yields and how much profit each generation can earn.
Four details that turn technology into returns
BANDWIDTH How quickly data moves. | POWER How efficiently it moves. | |
YIELD How much production becomes saleable product. | CAPACITY Whether customers can obtain enough of it. | |
A technically impressive chip must still be manufactured economically and delivered consistently.
AI spending becomes shareholder value only when suppliers turn demand into durable cash generation. |
|
04 / COMPETITION FOR THE NEXT DECADE One AI economy. |  |
These five companies capture different parts of the same infrastructure investment.
COMPANY / TICKER | LATEST QUARTER | REVENUE / YoY | OP. MARGIN |
|---|---|---|---|
Samsung / 005930.KS | Q3 2026 guidance | KRW 195T / +126.6% | 55.1%* |
SK hynix / 000660.KS | Q2 2026 | KRW 79.32T / +257% | 76.3%* |
Micron / MU | Q4 FY2026 | USD 54.23B / +379% | 80.7% |
NVIDIA / NVDA | Q2 FY2027 | USD 96.22B / +106% | 66.2%* |
Broadcom / AVGO | Q3 FY2026 | USD 29.59B / +86% | 53.9%* |
Sources [1, 8]. * TIC calculations from reported operating profit and revenue. Samsung/SK hynix use K-IFRS; U.S. companies use GAAP. SK hynix release figures are preliminary. Period ends: Sep. 30, Jun. 30, Sep. 3, Jul. 26 and Aug. 2, respectively. Fiscal calendars and business mixes differ.
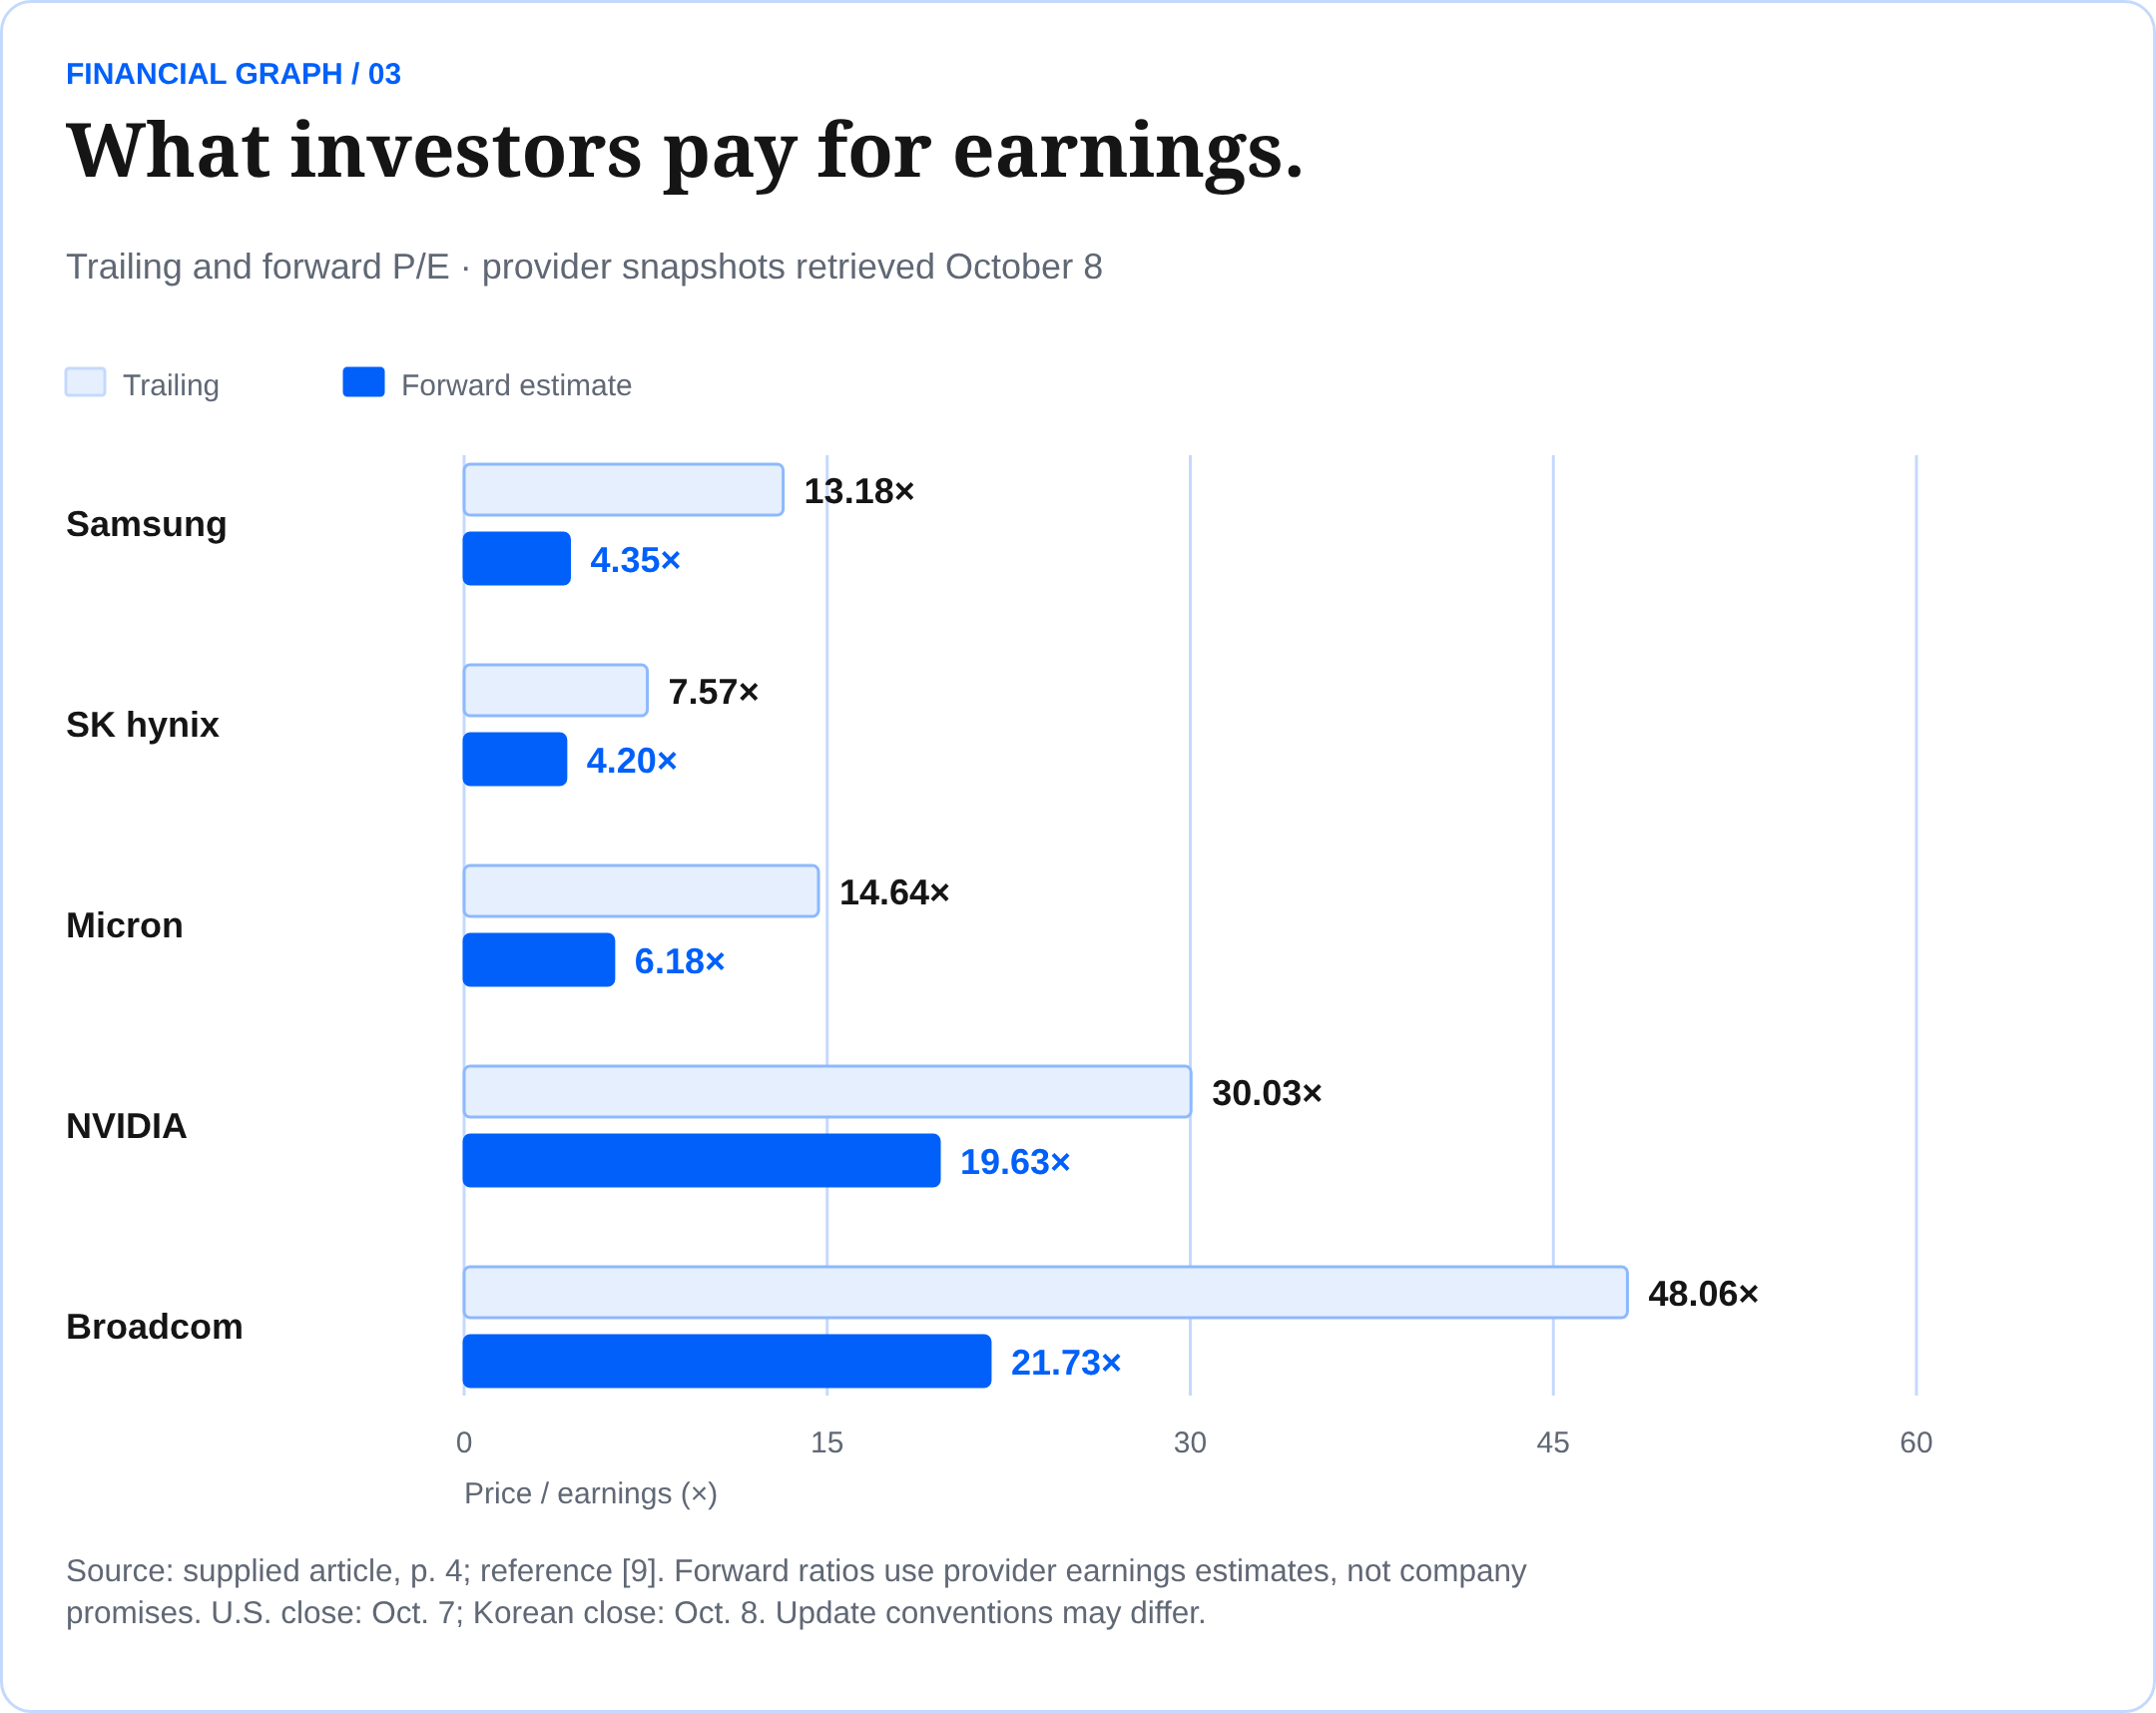
MARKET SNAPSHOT / PROVIDER DATA RETRIEVED OCTOBER 8 [9]
COMPANY | TRAILING P/E | FORWARD P/E¹ | 52-WEEK PRICE² |
|---|---|---|---|
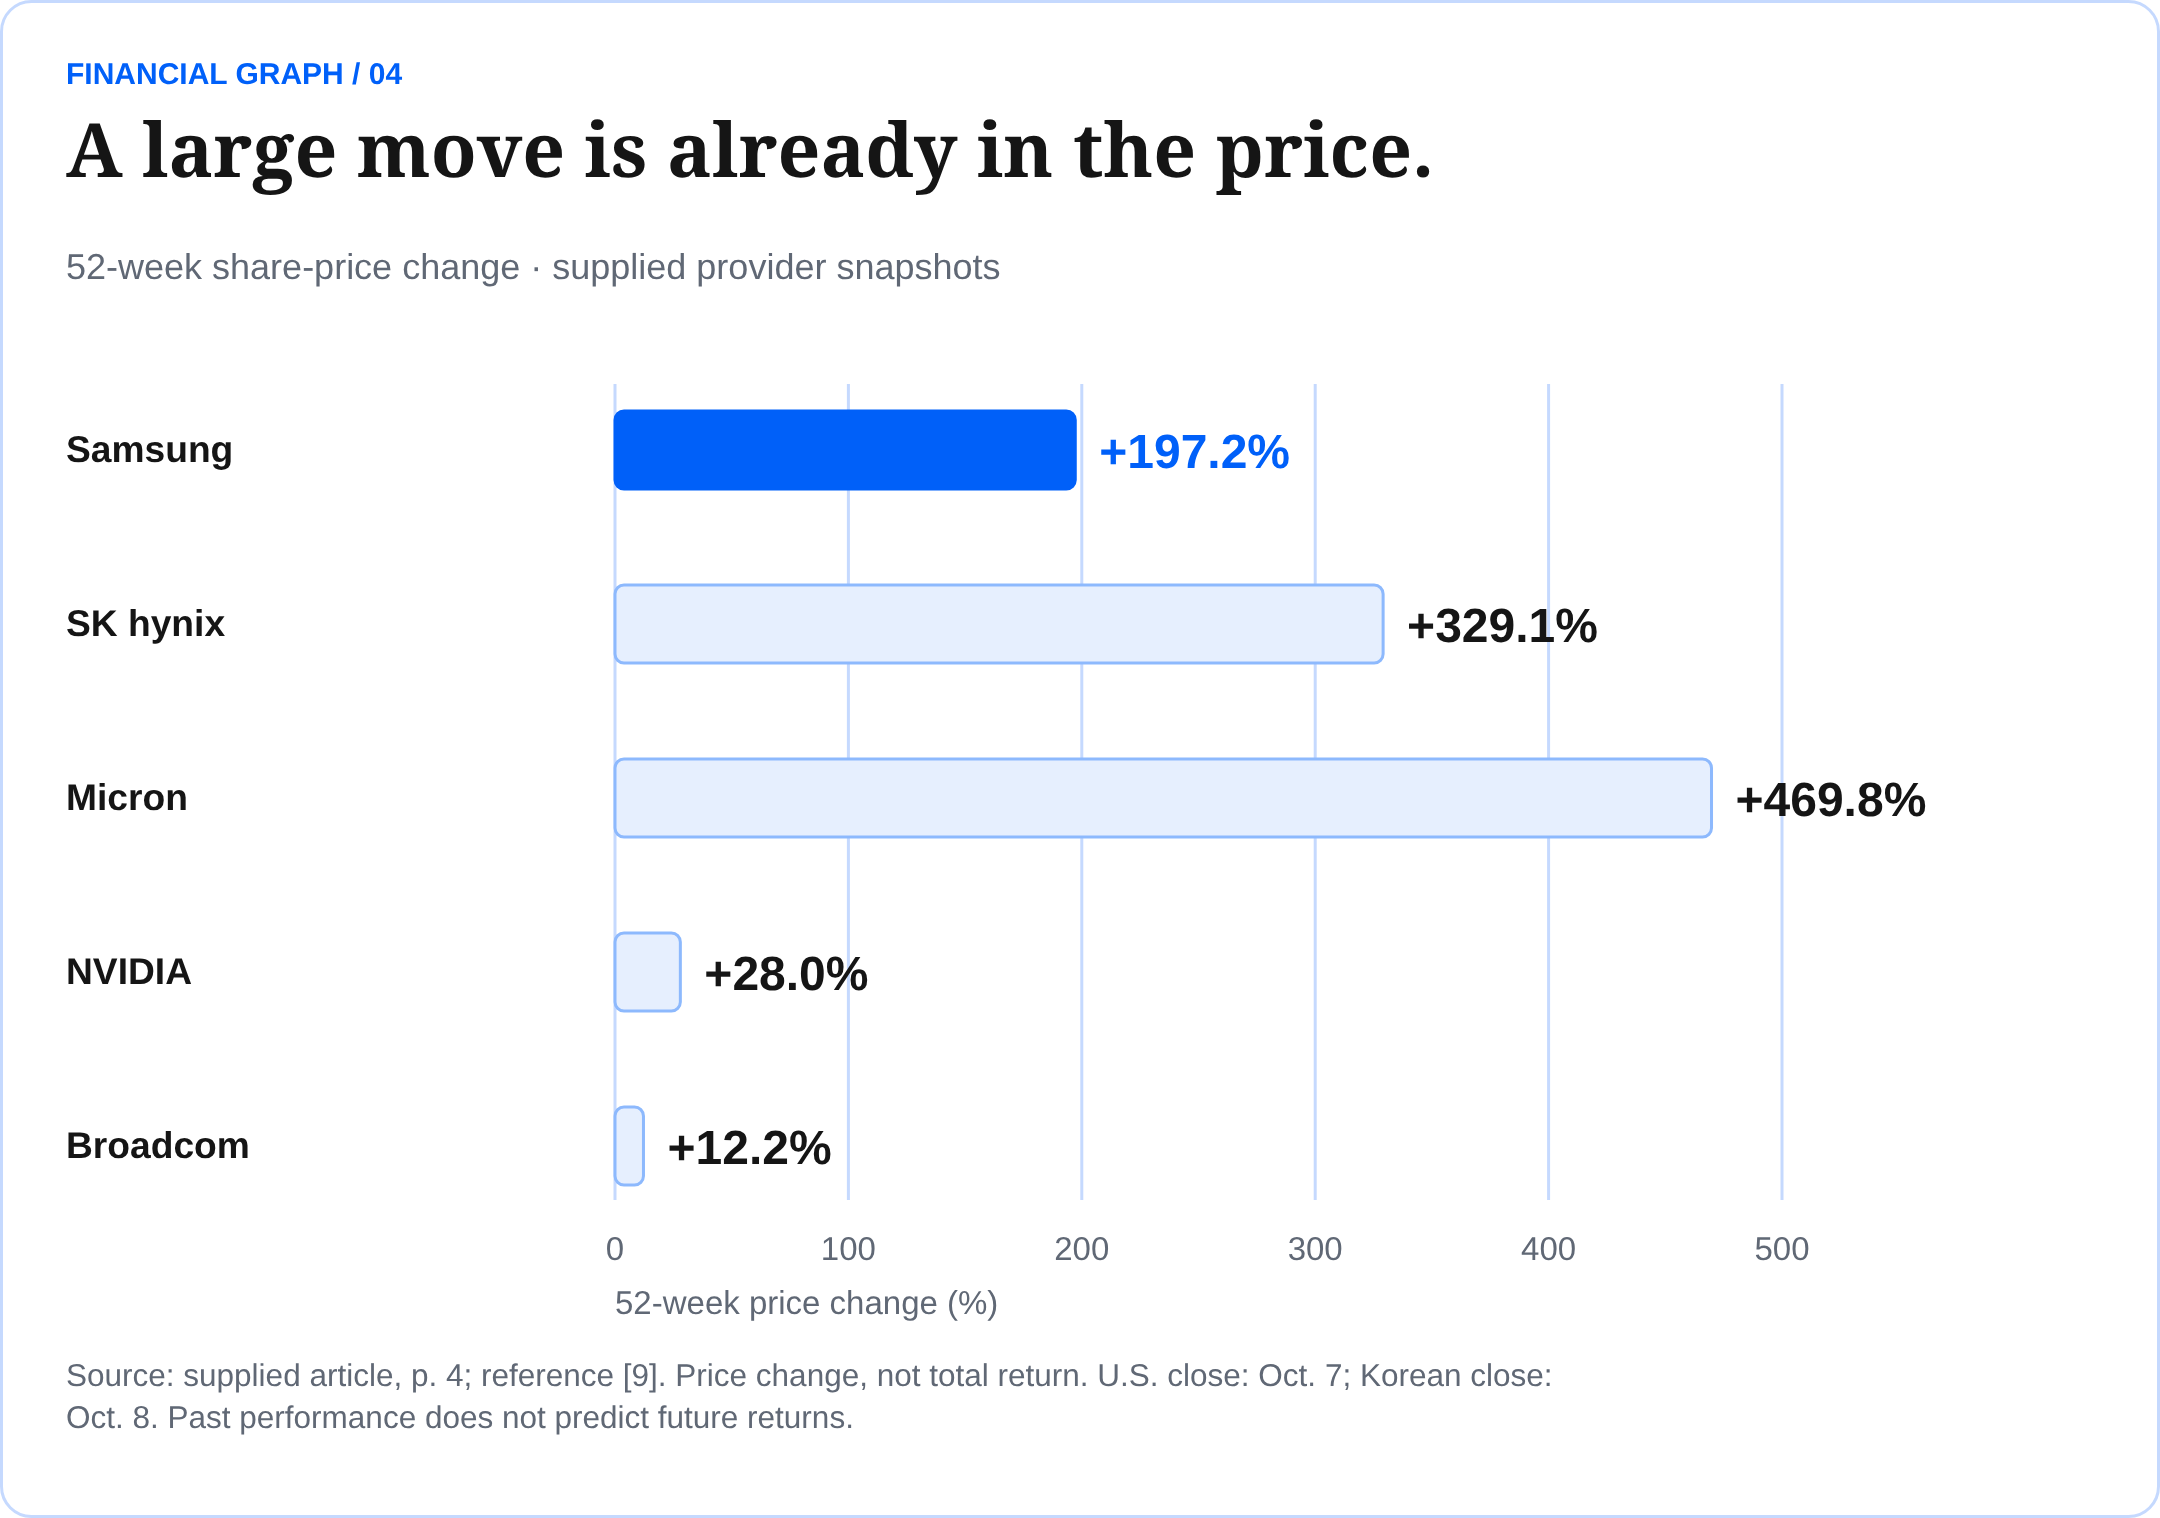
Samsung | 13.18× | 4.35× | +197.2% |
SK hynix | 7.57× | 4.20× | +329.1% |
Micron | 14.64× | 6.18× | +469.8% |
NVIDIA | 30.03× | 19.63× | +28.0% |
Broadcom | 48.06× | 21.73× | +12.2% |
¹ Based on provider earnings estimates, not company promises. ² Price change, not total return. U.S. close: Oct. 7; Korean close: Oct. 8. Ratios are provider snapshots and may use different update conventions. [9]
How the economics differ
Samsung, SK hynix and Micron provide memory and storage. NVIDIA builds computing platforms; Broadcom designs custom accelerators and networking products, alongside its software business. TSMC is the key foundry competitor to examine when assessing Samsung’s contract manufacturing opportunity. [2, 4, 8]
TIC INTERPRETATION Low forward multiples in memory signal both expected earnings strength and doubt about its duration. Higher platform multiples ask investors to pay more for expected durability. Broadcom’s acquisition accounting also makes GAAP and adjusted earnings comparisons particularly important. |
05 / WOULD YOU INVEST TODAY? A great company. |  |
The opportunity depends on the earnings that survive after the exceptional quarter.
Samsung’s nearly threefold 52-week price increase shows that investors have already recognized much of the change. Its provider snapshot shows 2.95× book value and 11.79× trailing free cash flow, alongside the P/E figures in the preceding section. Those measures offer different perspectives on a capital-intensive business. [9]
The forward P/E looks inexpensive only if the expected earnings arrive and endure. A simple illustration: if profit falls by half and the share price stays unchanged, the P/E doubles. A lower multiple cannot, on its own, tell us whether a stock is cheap or its earnings are near a cyclical peak.
2027 SCENARIOS / TIC ANALYSIS, NOT FORECASTS OR PRICE TARGETS
CASE | MEASURABLE EVIDENCE | EARNINGS / VALUATION IMPLICATION |
|---|---|---|
BULL | HBM revenue and shipments rise; server mix improves; margins hold across two reporting periods. | More durable profits could support the valuation. Watch whether capacity expansion earns attractive returns. |
BASE | Shipments grow; pricing gains slow; operating cash flow continues to exceed PP&E purchases. | Earnings expand more moderately. Value on normalized margins rather than annualizing Q3. |
BEAR | DRAM/NAND prices fall; inventories rise; DS margins contract; foundry utilization disappoints. | Profit estimates fall and apparently low P/E ratios rise. A strong balance sheet cushions operations, not the share price. |
How to access Samsung shares
The primary Korean shares are 005930 (common; ISIN KR7005930003) and 005935 (preferred; ISIN KR7005931001). Samsung also identifies London-listed GDRs; use the exact ISIN to verify the receipt and share class with your broker. Different classes and receipts can have different prices, liquidity and rights. [10]
IBKR advertises KRX access for eligible clients. Fidelity’s published direct international-market list excludes Korea; Schwab’s Global Account information and Tiger Trade’s public offering do not establish direct Samsung KRX access. Confirm your regional entity, instrument, permissions, FX costs and fees before trading. These links are access resources, not endorsements. [11]
| FIDELITY | CHARLES SCHWAB | INTERACTIVE BROKERS | TIGER TRADE |
The decision: Is the market underestimating durable AI memory earnings, or correctly discounting an extraordinary cycle? |
06 / THE INVESTOR CALL OUTLOOK Follow the evidence. |  |
The next chapter will be measured in shipments, margins and cash, not product announcements alone.
Start with the October 29 detailed earnings release. Track HBM commercial adoption, DRAM and NAND prices, foundry utilization, capital spending and cash conversion over the next 6–12 months. Compare those results with customers’ infrastructure budgets. [4]
TIC WATCHLIST | MEASURABLE CATALYST | KEY RISK |
|---|---|---|
Samsung / 005930.KS | HBM sales growth and DS margin | Memory-price normalization |
SK hynix / 000660.KS | HBM4 shipment ramp | Capacity / customer concentration |
Micron / MU | Cash conversion after capacity spend | Pricing and production execution |
NVIDIA / NVDA | Data Center revenue and margin | Customer budgets / export rules |
Broadcom / AVGO | Custom AI revenue and free cash flow | Large-customer concentration |
THE INVESTOR CALL INDEX (TIC INDEX) This theme offers a framework for studying computing, memory, networking and manufacturing together. This watchlist is not a statement of TIC Index membership; no constituent inclusion or index performance is asserted. |
The AI economy will be built by an industrial ecosystem. Understanding who supplies that ecosystem may be just as valuable as understanding who designs its most powerful chips. |
RESEARCH NOTES / CLICKABLE SOURCES
[1] Samsung Q3 guidance, Oct. 8; growth and margin calculations by TIC.
[2] Samsung Q2 results, Jul. 30.
[3] Samsung Q2 presentation: balance sheet and cash flow, pp. 14–15.
[4] Reuters via MarketScreener, Oct. 8: results date and industry context.
[5] Samsung HBM4 commercial shipments, Feb. 12.
[6] Samsung GTC / NVIDIA relationship, Mar. 17.
[7] Samsung HBM4E samples, May 29.
[8] Latest releases: SK hynix, Jul. 29, Micron, Sep. 30, NVIDIA, Aug. 26, Broadcom, Sep. 2.
[9] Stock Analysis / S&P Global snapshots, Oct. 8: Samsung, SK hynix, MU, NVDA, AVGO. Ratios are not TIC target valuations.
[10] Samsung listing information. [11] Broker pages linked in the preceding section; access depends on jurisdiction and account.
| SUBSCRIBE NOW FOR FREE | GET IN TOUCH WITH OUR TEAM |
Educational research, not personalized investment advice or an offer to buy securities. Prices, estimates and preliminary results can change. Stocks, foreign currencies and depositary receipts can lose value; past performance does not predict future returns. Scenarios are TIC interpretations.
READY TO DO YOUR OWN RESEARCH? If you decide to trade, use a regulated broker appropriate to your jurisdiction and independently research each investment. The links below are provided for convenience, not as broker endorsements. Availability of individual securities varies by platform and jurisdiction.
Tiger Trade link opens Tiger Brokers' official regional site; availability and regulation depend on jurisdiction. |
|
Production note. Presentation edition of the supplied October 8, 2026 article; figures, dates and company claims have not been independently verified or updated. Q3 Samsung figures are preliminary guidance. Cross-company accounting, periods and currencies differ. Forward ratios use estimates; 2027 scenarios are not forecasts. The PP&E punctuation and internal page references have been normalized for this continuous layout. Typography follows the approved edition using Noto Serif Condensed Bold / Arimo substitutes; font files are not included.
 Research that matters. Performance you can measure. Insight you can trust. www.theinvestorcall.com |  |
