
THE INVESTOR CALL / MATERIALS + TECHNOLOGY / OCTOBER 9, 2026
|
MATERIALS / TECHNOLOGY / INVESTING Concrete built |  |
A vast market. A new generation of technology. And a question investors should ask: who will create more value from every tonne?
The next industrial opportunity may be beneath our feet.
Before a data center can run its first AI model, somebody has to build its foundations. Before an airport welcomes passengers, somebody has to pour its runways. Concrete quietly connects the digital economy to the physical world.
That makes this a story about far more than cement. Better materials can help us build housing, roads, bridges and energy infrastructure with less waste and greater confidence. The opportunity is to improve an essential product at enormous scale.
14B m³ ANNUAL CONCRETE 2021 roadmap scale benchmark | ~34B tonnes ILLUSTRATIVE MASS Using 2.4 tonnes per m³ | 2.4 t/m³ DENSITY ASSUMPTION Varies by concrete mix |
GCCA’s 2021 roadmap cited about 14 billion cubic meters of concrete a year. At an illustrative density of 2.4 tonnes per cubic meter, that implies roughly 34 billion tonnes. This is a scale benchmark, not a fresh 2026 production count. Concrete is the most-used human-made material by volume; that does not make it the largest industry by revenue.
The world does not need less ambition.
It needs better ways to build.
Scale benchmark: GCCA, October 2021 roadmap announcement. Mass conversion: TIC illustration; density varies by mix.
01 / FOLLOW THE MONEY A trillion-dollar |  |
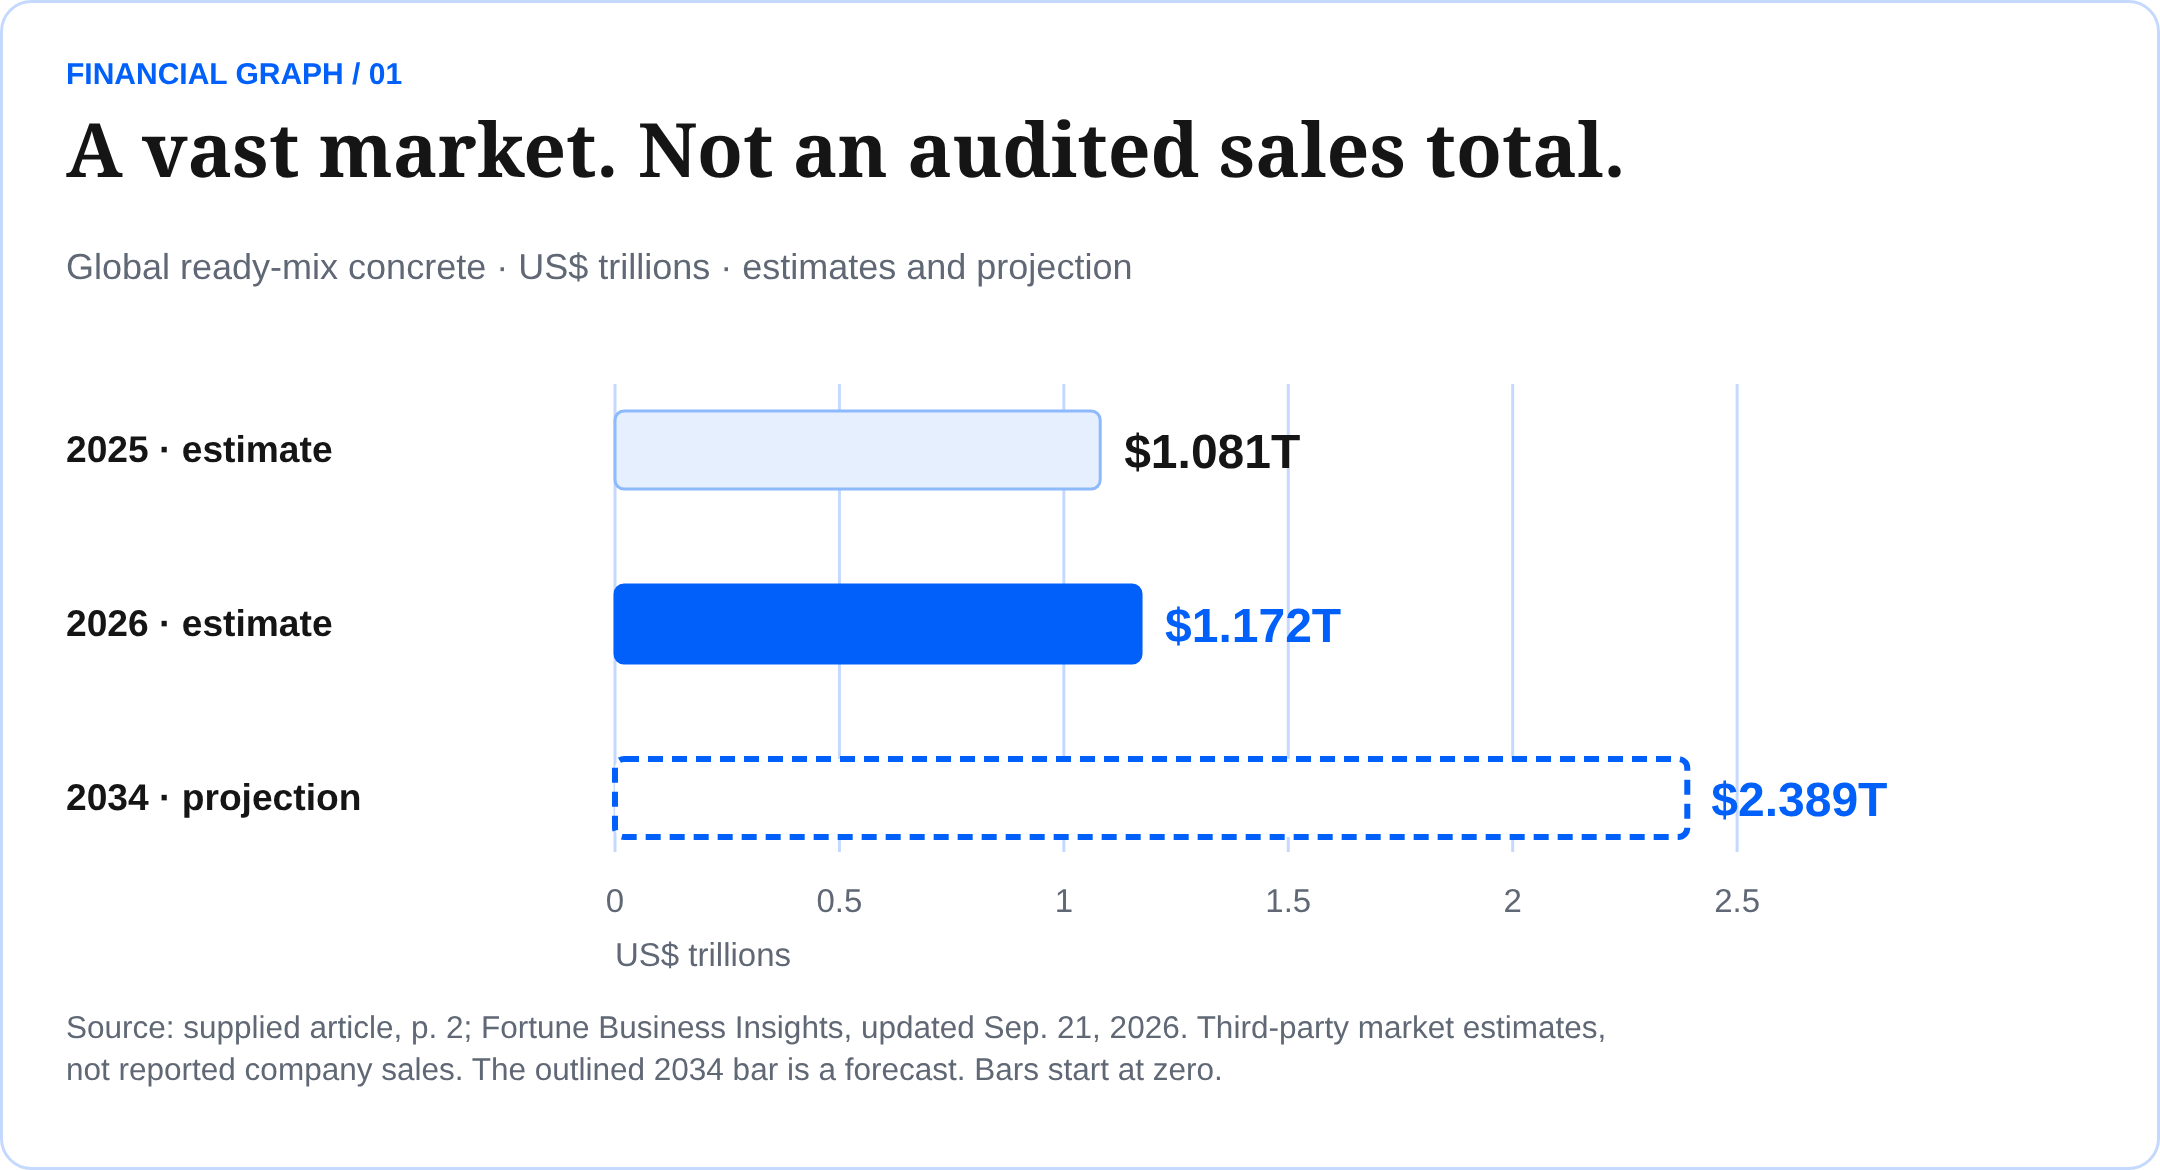
There is no single audited global concrete-revenue total. One useful benchmark is ready-mix: concrete batched for delivery to construction sites.
Fortune Business Insights estimates $1.081 trillion for 2025 and $1.172 trillion for 2026. Its 2034 projection is $2.389 trillion. These are third-party market estimates, not reported global company sales, and other studies can use different definitions and methods.
Know which market you are measuring.
Business layer | What the revenue represents |
|---|---|
Cement | The binder that holds sand, stone and water together. |
Ready-mix concrete | Mixed material produced and delivered to sites. |
Precast and concrete products | Manufactured elements: panels, pipes, beams and more. |
Construction | Materials plus labor, equipment, design and project delivery. |
Adding cement and ready-mix sales can double-count value. The sector’s size is not a small technology supplier’s addressable market.
A 1% shift in value across a $1.172T market is about $11.7B. Capturing it is the hard part.
Market figures and methodology: Fortune Business Insights — Ready-Mix Concrete Market. No categories have been added together.
02 / WHY IMPROVEMENT MATTERS We need |  |
GCCA attributes roughly 7% of global CO₂ emissions to the cement and concrete sector. The breakthrough investors want would lower delivered cost, cut emissions, improve durability and make schedules more predictable. Today’s solutions address parts of that challenge; none reviewed here proves a universal 30% cut in total project cost.
The pressure | The opportunity |
|---|---|
Cost and logistics | Use less binder; optimize mixes, transport and waste. |
Time and predictability | Measure actual strength; improve curing and scheduling. |
Durability | Design mixes and reinforcement for lower lifetime repair needs. |
Sustainability | Reduce clinker, recycle materials and capture or mineralize CO₂. |
Already reaching customers | The next steps to scale | |
Lower-clinker binders and admixtures. Commercial blended cements and chemical additives can reduce cement demand while maintaining specified performance. Benefits depend on available feedstocks and the application. | Digital concrete. Sensors, testing and AI-assisted mix optimization can reduce uncertainty. Sika invested in Giatec in 2025, joining a network that includes Heidelberg Materials. Better information can support decisions about material use and construction timing. | |
Carbon mineralization. CarbonCure says its ready-mix system typically reduces cement content by 3–5%. That is a manufacturer claim about cement usage, not a 3–5% saving on an entire building. | Alternative chemistries. Electrochemical cement and silicate-rock processes are emerging. Pilot results and standards compliance are meaningful milestones; repeatable industrial output and customer economics remain decisive. | |
Carbon capture. Heidelberg’s Brevik CCS facility opened in June 2025. Its design aims to capture about 400,000 tonnes of CO₂ annually, approximately half the plant’s emissions. evoZero deliveries show the move from engineering project to commercial product. | Application-specific advances. Ultra-high-performance mixes and 3D printing have specialist uses. Self-healing concrete and other emerging materials require broader validation. More strength or automation does not automatically mean lower total cost. | |
The breakthrough investors want: better performance, proven economics and global scalability.
New technology and better integration are both needed. Certification, feedstock supply and reliable industrial output decide whether a promising idea becomes a durable business.
Evidence: CarbonCure ready-mix; Heidelberg CCS; Sika/Giatec; GCCA 2025/26 report. Company claims are identified.
|
03 / FROM TONNES TO VALUE What would 10%, |  |
Imagine a $100 million construction project. A genuine improvement across the entire budget would be powerful. But the denominator matters: saving money on concrete is different from saving the same percentage on the whole project.
Illustrative total-project saving | Value created |
|---|---|
10% | $10 million |
20% | $20 million |
30% | $30 million |
Scenario only. These percentages are not demonstrated project savings from the technologies described in this edition.
Start with the actual cost structure.
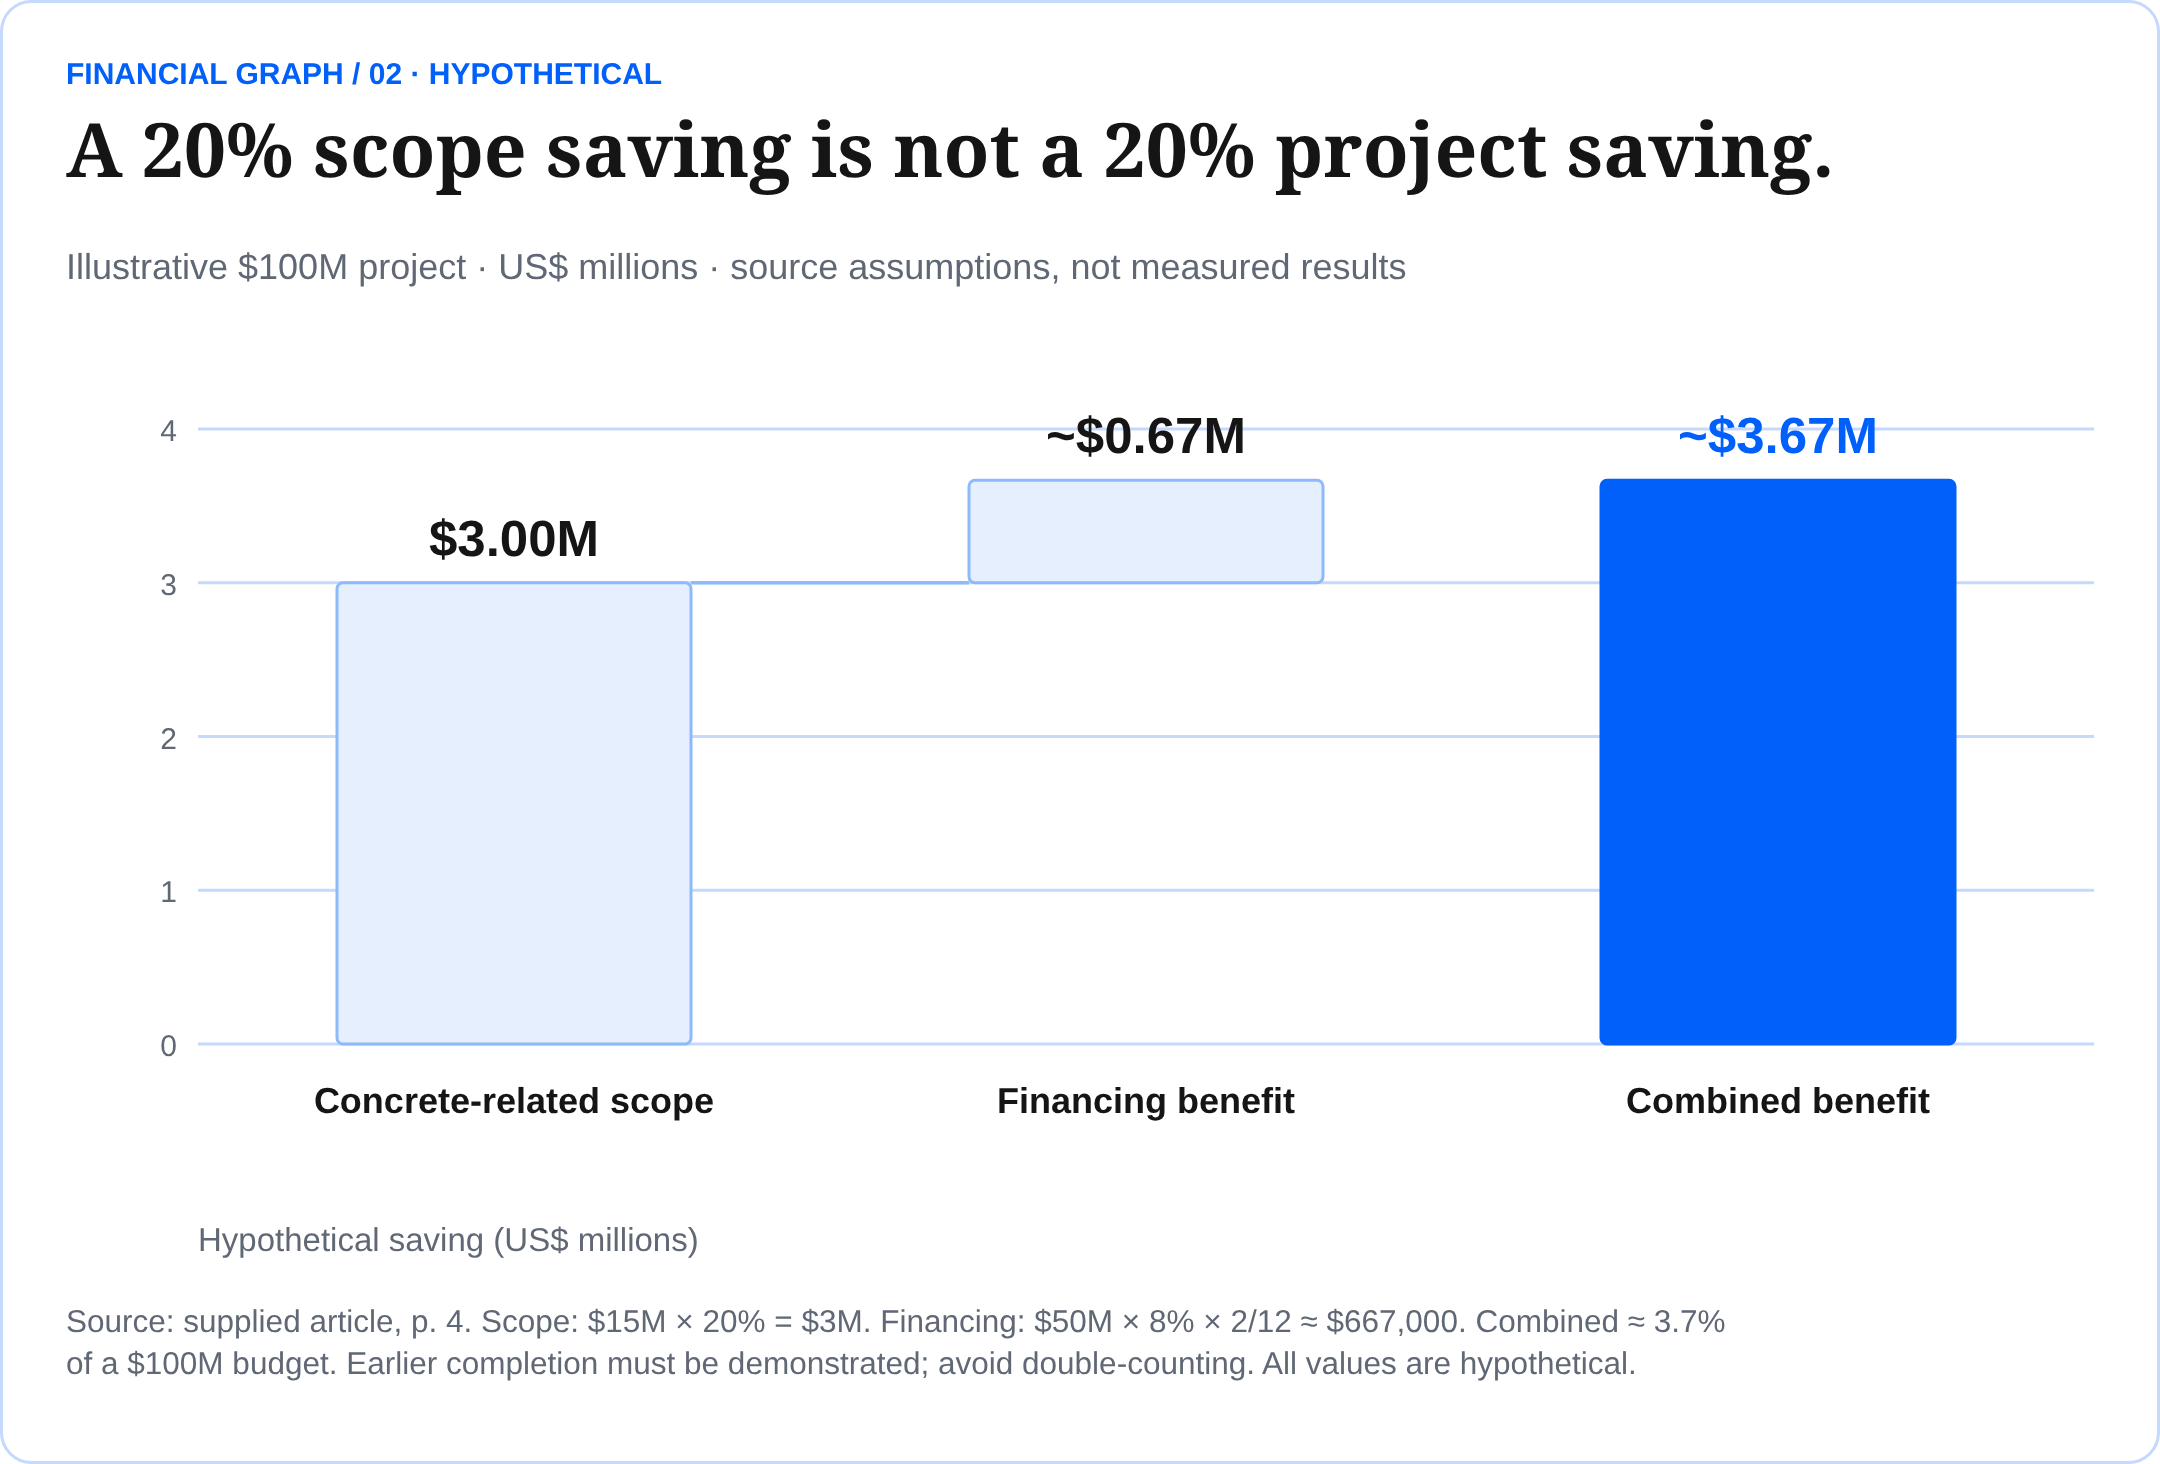
Suppose concrete-related materials and work account for $15 million of the budget. A 20% reduction in that scope saves $3 million, or 3% of total project cost. It does not save $20 million. The 15% cost share is an assumption, not an industry average.
If better strength monitoring or a different construction method also brings completion forward, the developer may reduce financing and site overhead. For example, two months less on a $50 million average financed balance at 8% annual interest saves approximately $667,000, using simple interest. Whether the project can actually finish earlier must be demonstrated.
Combine that hypothetical financing benefit with the $3 million scope saving and the total is about $3.67 million, or 3.7% of the project budget. Add only independently measured benefits: avoid counting the same labor, overhead or timing saving twice.
Who gets paid when concrete gets better?
Developers gain from lower budgets and earlier use. Contractors can gain from less rework and efficient execution. Manufacturers benefit if reduced inputs outweigh energy, equipment and licensing costs. Technology owners can earn through licensing, software, additives or partnerships.
Lower cost for the customer can coexist with higher margins for the supplier.
A solution earns its place through measurable customer value. Longer life and lower maintenance add potential benefits; test them in a discounted lifetime-cost comparison with explicit repair assumptions.
All project and financing calculations in this section are TIC hypothetical scenarios. CarbonCure’s 3–5% cement-content claim in the technology section is a separate, narrower measure.
04 / SEVEN WAYS TO OWN THE SECTOR Who is already |  |
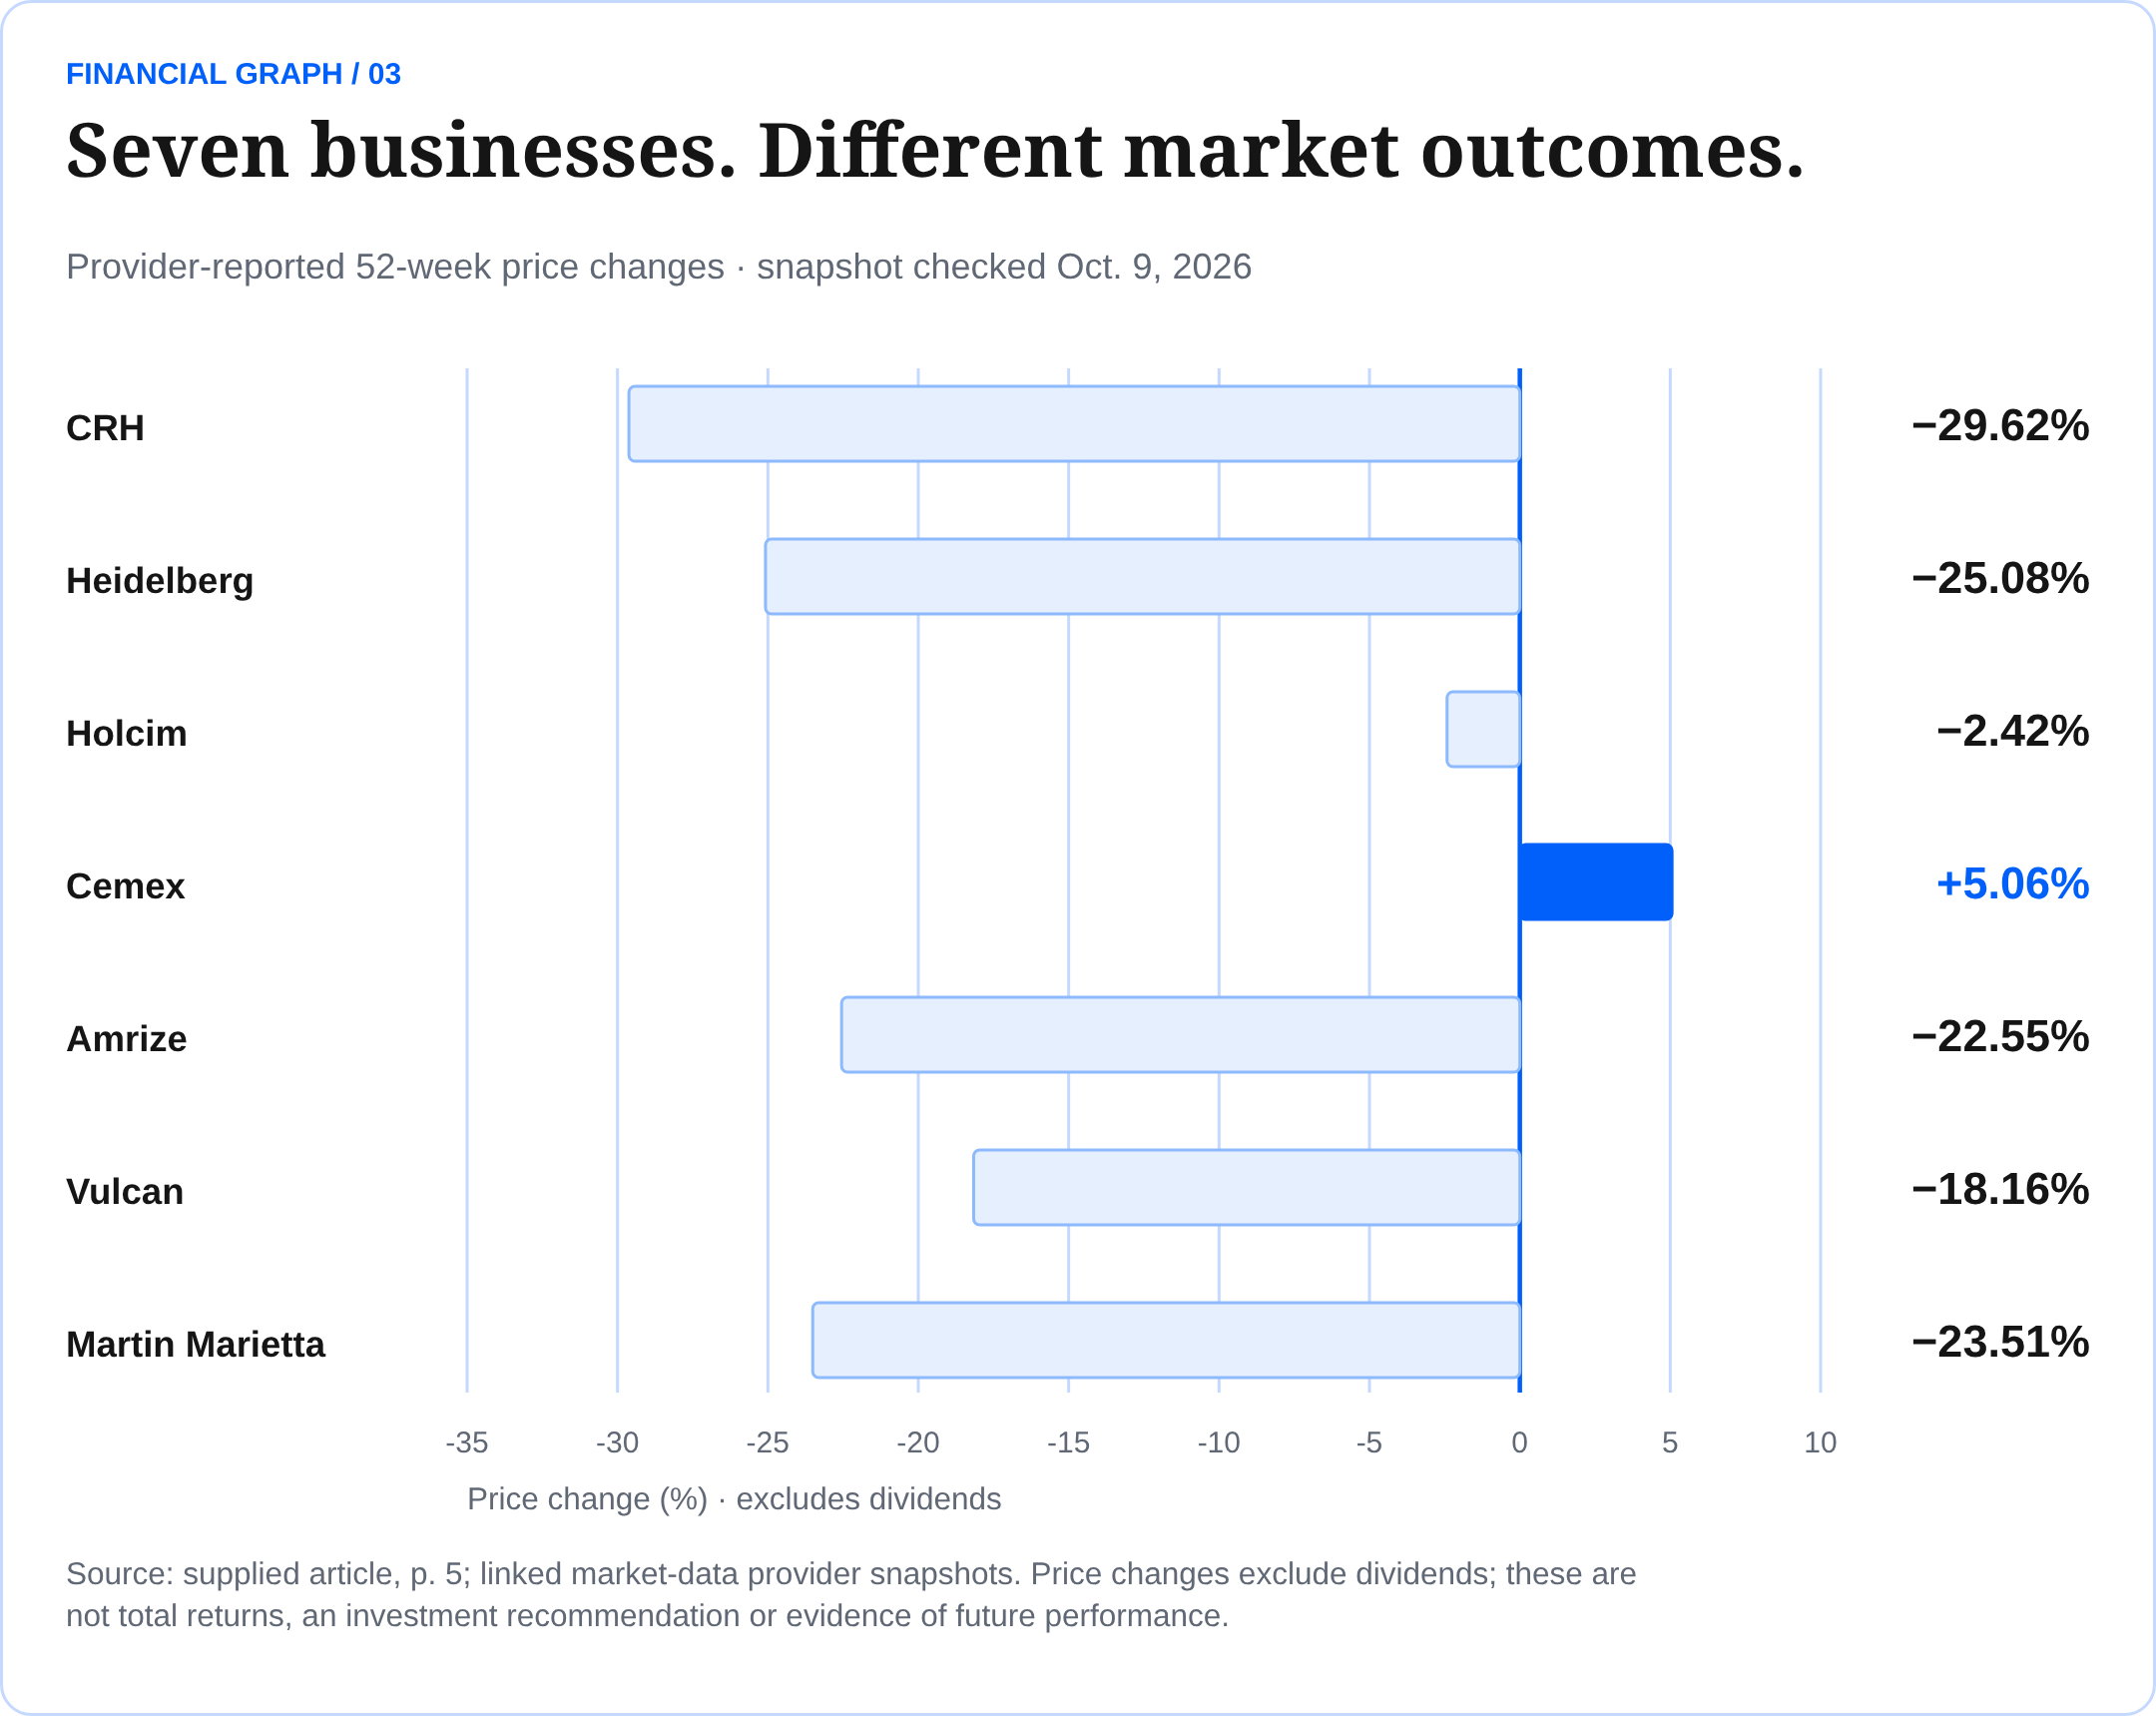
Seven listed businesses offer different routes into the story. Group revenues include products beyond concrete; a big company is not automatically a technology leader.
Company / listing | FY25 sales | Price¹ | Mkt cap¹ | 52wk² |
|---|---|---|---|---|
CRH · NYSE: CRH | $37.45B | $81.88 | $54.47B | −29.62% |
Heidelberg · Xetra: HEI | €21.55B | €139.80 | €24.52B | −25.08% |
Holcim · SIX: HOLN | CHF15.72B | CHF62.84 | CHF34.76B | −2.42% |
Cemex · NYSE: CX (ADS) | $16.13B | $9.56 | $13.95B | +5.06% |
Amrize · NYSE: AMRZ | $11.82B | $36.50 | $19.68B | −22.55% |
Vulcan · NYSE: VMC | $7.94B | $246.26 | $31.91B | −18.16% |
Martin Marietta · NYSE: MLM | $6.15B | $481.57 | $34.20B | −23.51% |
¹ Quotes shown for October 8, 2026; U.S. regular-session close and European delayed end-of-day snapshots. Market caps are provider snapshots and may update separately. ² Provider-reported 52-week price changes, checked October 9; excludes dividends.
The business, the advantage, the watch point
CRH
Scale in aggregates, infrastructure and building solutions. FY25 adjusted EBITDA margin 20.5%. Venture investment adds optionality. Watch acquisition integration, leverage and construction demand.
Heidelberg Materials
Cement, aggregates and ready-mix; commercial CCS and evoZero are the clearest technology evidence in this group. FY25 RCOBD margin 21.8%. Watch energy costs, CCS capital intensity and customer premiums.
Holcim
Lower-carbon products are gaining traction: ECOPact reached 31% of ready-mix sales in 2025. Recurring EBIT margin 18.3%. Watch capital allocation and whether product adoption improves returns.
Cemex
Global cement and ready-mix with an efficiency-led investment case. FY25 operating EBITDA margin 19.1%. Watch regional demand, currencies and conversion of cost savings into cash.
Amrize
North American materials plus roofing and building envelope. FY25 net income $1.182B, about 10.0% of sales. Independent after Holcim’s June 2025 separation; watch margins and execution.
Vulcan Materials
Scarce local quarries and aggregates pricing support its advantage; not a new-binder pure play. FY25 earnings about $1.08B, roughly 13.6% of sales. Watch volumes and valuation.
Martin Marietta
An aggregates-led platform with expansion potential. FY25 continuing-operations gross margin about 30.7%. Watch integration and portfolio changes; asset-sale gains complicate profit comparisons.
Research discipline: margin definitions differ and are not directly comparable. Consistent standalone concrete R&D spending was not established for all seven, so no spending-based innovation ranking is claimed.
Financials: FY2025 company releases/filings. Prices, market caps and 52-week changes: linked market-data directory in the final section. Source links are also attached to the shortlist and research notes. Original directory link.
05 / WHERE WE WOULD START Three stocks. |  |
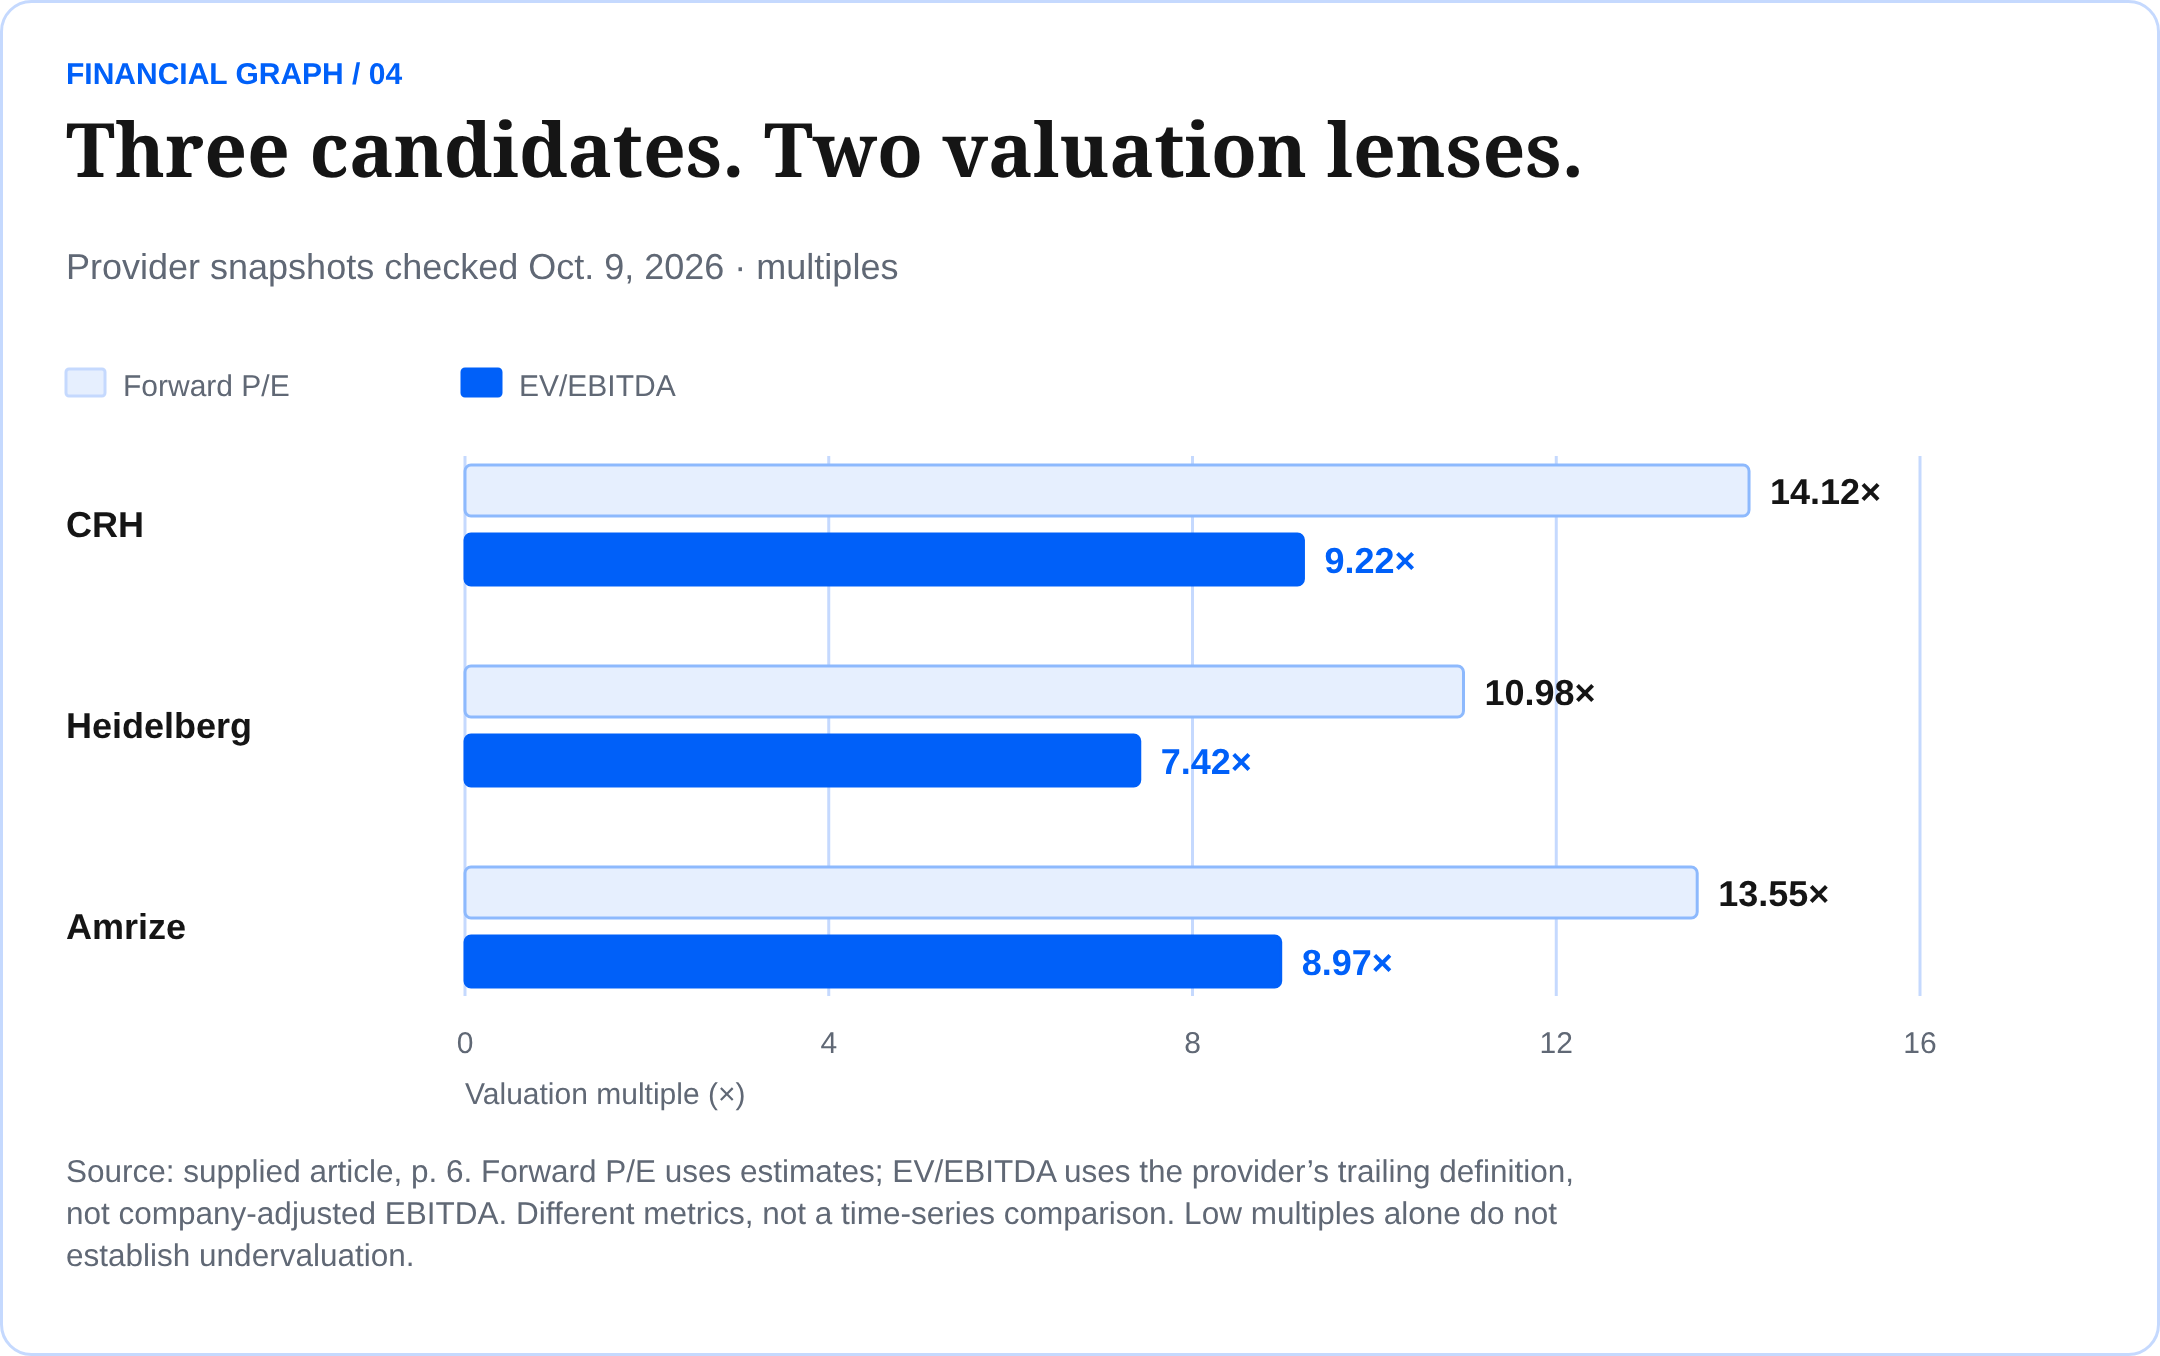
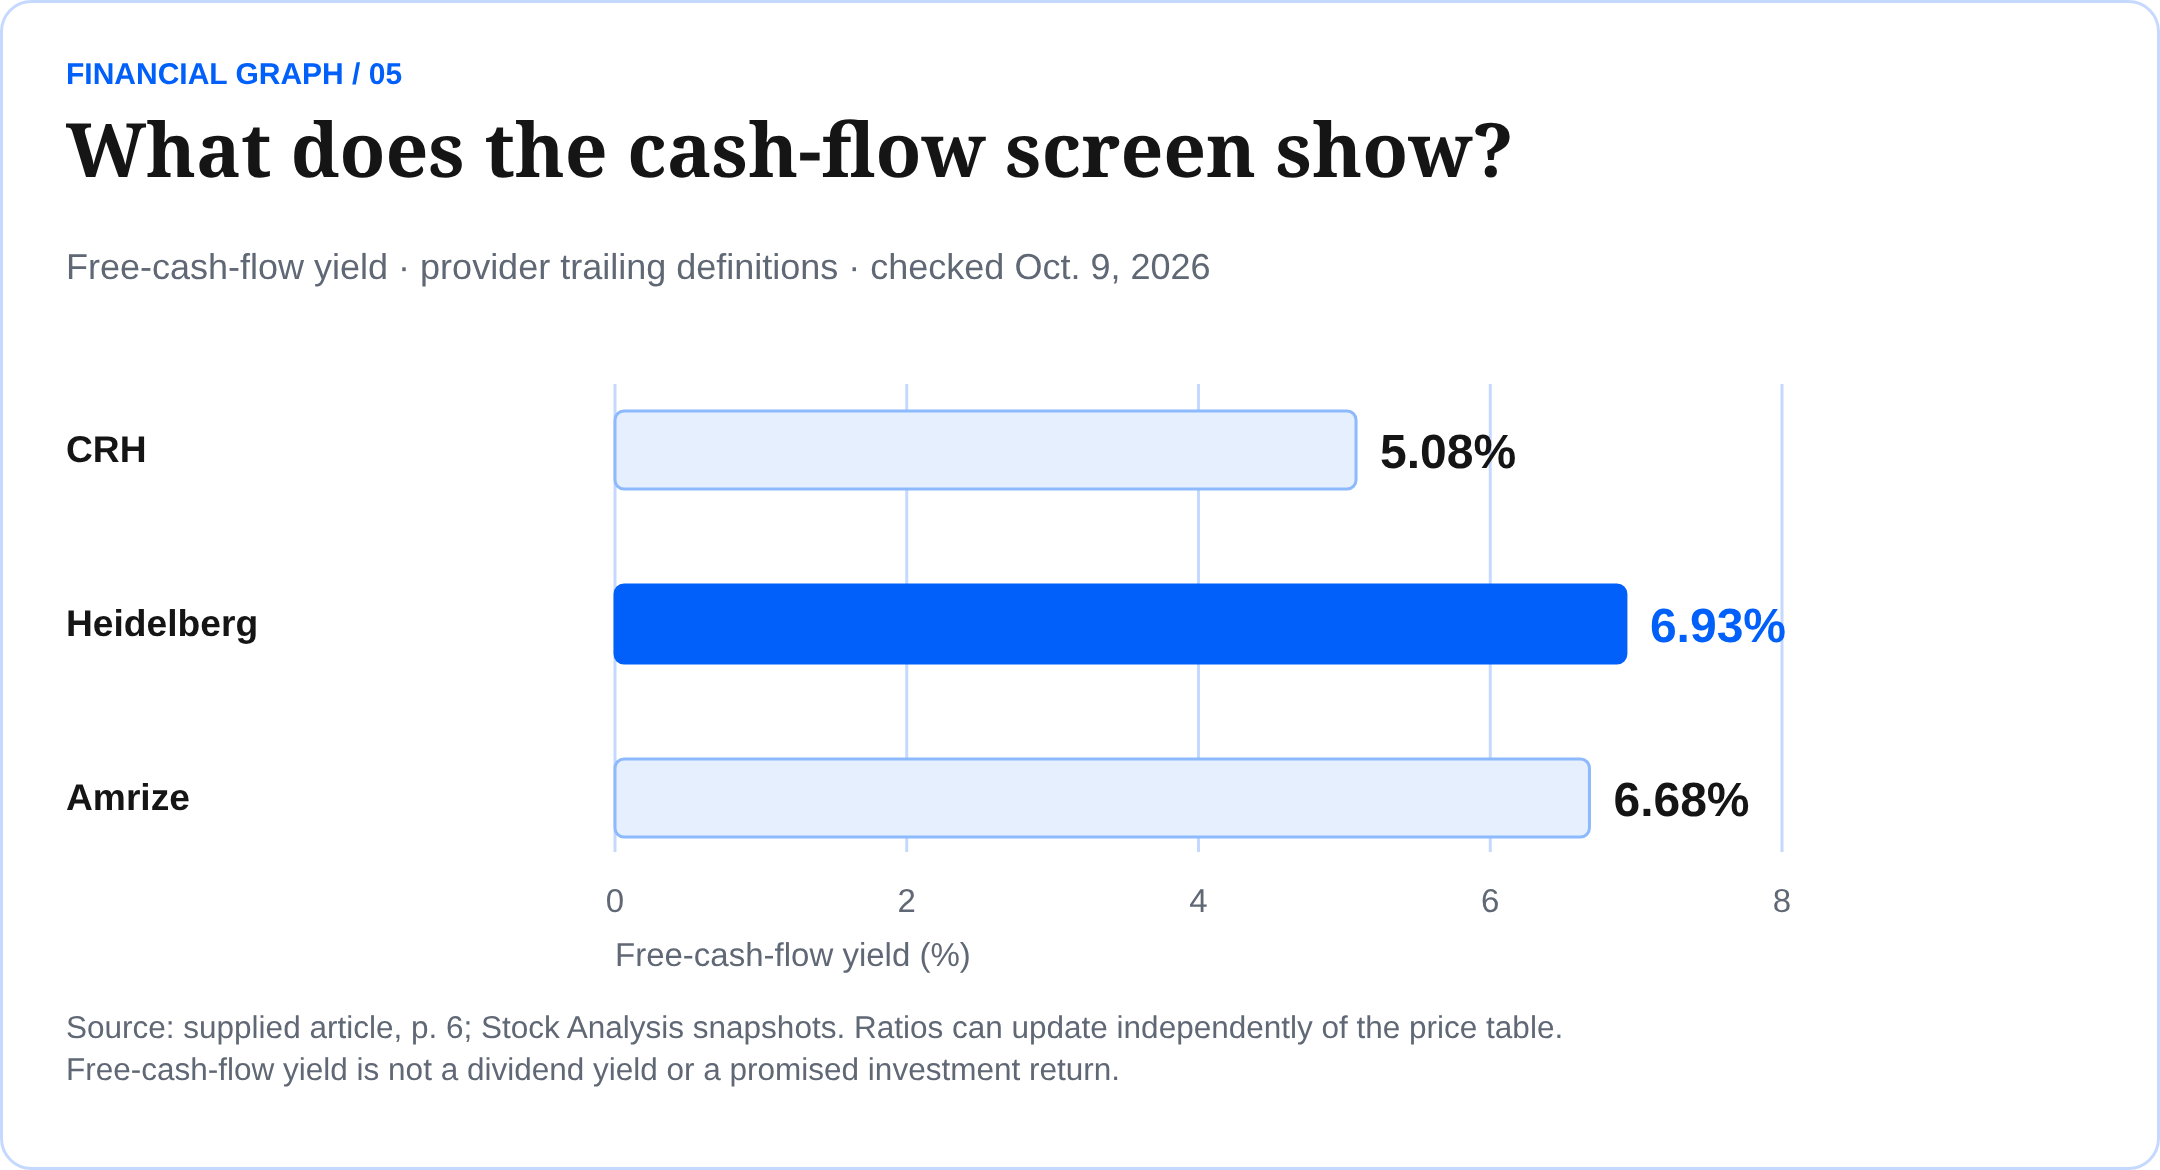
Our editorial order is CRH, Heidelberg Materials, then Amrize. CRH offers the strongest balance of scale, operating evidence and valuation in this focused shortlist. Heidelberg provides the clearest large-company technology case; Amrize adds regional growth. This is a research priority, not a claim of guaranteed outperformance.
Snapshot³ | CRH | Heidelberg | Amrize |
|---|---|---|---|
Forward P/E | 14.12× | 10.98× | 13.55× |
EV/EBITDA | 9.22× | 7.42× | 8.97× |
Free-cash-flow yield | 5.08% | 6.93% | 6.68% |
³ Stock Analysis snapshots checked October 9. Forward P/E uses estimates; EV/EBITDA and FCF yield use the provider’s trailing definitions. They differ from company-adjusted EBITDA. Ratios can update independently of the price table.
01 CRH — The established leader
Growth and profitability: 2025 sales rose 5% and adjusted EBITDA rose 11%. Q2 2026 revenue grew 6%; the company retained its $8.1–$8.5B full-year adjusted EBITDA outlook. Innovation: investment in Sublime gives exposure to a new process alongside an existing materials business. Valuation: about 14× forward earnings is lower than Vulcan’s roughly 26×, although their mixes and margins differ.
Our stance: first candidate for staged consideration. Over 12–36 months, watch infrastructure demand, pricing and acquisition execution. Large deals can raise debt; the case should work without a cement breakthrough.
02 Heidelberg Materials — The technology opportunity
Growth and profitability: FY25 revenue rose 1.4%; RCO reached €3.4B and free cash flow €2.1B. Innovation: Brevik and evoZero demonstrate industrial deployment. Valuation: the lowest forward P/E in our three-stock screen is attractive enough for further work, but low multiples alone do not establish undervaluation.
Our stance: technology-led consideration with a measured allocation. Watch commercial uptake, capture costs, capital returns and energy exposure over the next 12–36 months. Carbon capture does not automatically lower cost.
03 Amrize — The growth candidate
Growth and profitability: Q2 2026 revenue grew 8.6% to $3.494B. Innovation: the attraction is a scaled regional platform and product execution, rather than a proven proprietary cement breakthrough. Valuation: about 13.6× forward earnings makes the growth case worth examining; its broader building-envelope exposure changes the comparison.
Our stance: watch, then consider when margin and cash-conversion progress confirm the growth. Catalysts include infrastructure demand and operational execution; risks include weather, residential weakness and integration. Entry price still matters.
Sources: CRH FY25 / Q2 2026; Heidelberg FY25; Amrize Q2 2026. Valuation links: final section.
06 / THE NEXT CHAPTER The next winner |  |
Imagine concrete that is cheaper to use, easier to schedule, more durable and more sustainable. Its value could come from patents, a recurring additive, software or a license for every tonne produced. The idea is exciting. The business model makes it investable.
Watch the innovators — and the route to public markets.
CarbonCure already supplies carbon-mineralization systems. Sublime Systems is scaling an electrochemical cement process; CRH and Holcim announced $75M in combined investment in 2024. Brimstone is developing a silicate-rock process that co-produces cement and other materials. These are private companies, not directly purchasable listed stocks. Their claims and scale-up plans should not be treated as proven full-scale economics.
Established producers may license a process, invest in a developer or acquire it. They bring distribution, plants and customer relationships; newcomers can bring intellectual property. Investors should ask for repeat orders, standards approval, costs at industrial scale and cash generation after capital spending. A partnership is evidence of interest, not proof of meaningful future earnings.
Concrete built our world.
Reinventing it could help us build a better one.
Our verdict: there is reason for hope in an industry that can improve housing, mobility and infrastructure together. Start with businesses that can fund change, then follow the evidence. The future is about creating more value from every tonne.
Continue the research
| Fidelity | Charles Schwab | Interactive Brokers | Tiger Trade |
Availability depends on broker, exchange, jurisdiction and account permissions. Links are general resources, not confirmation of access to every security.
| SUBSCRIBE NOW FOR FREE | GET IN TOUCH WITH OUR TEAM |
Research checked October 9, 2026. Rankings are TIC editorial opinions, not personalized investment advice. Stocks can lose value. Market estimates, company guidance and hypothetical savings are labeled separately. No returns are promised.
|
Production note. Presentation edition of the supplied October 9, 2026 article. Figures, company claims and source-check dates are retained as supplied, not independently verified or updated for this design pass. Market estimates, forecasts and hypothetical savings are distinguished throughout. Tables retain their original currencies and differing margin definitions. Internal page references have been adapted to this continuous layout. Conceptual corner artwork replaces the source’s large conceptual photograph. Typography follows the approved Samsung edition using Noto Serif Condensed Bold / Arimo substitutes; font files are not included.
 Research that matters. Performance you can measure. Insight you can trust. www.theinvestorcall.com |  |
